Biology Reference
In-Depth Information
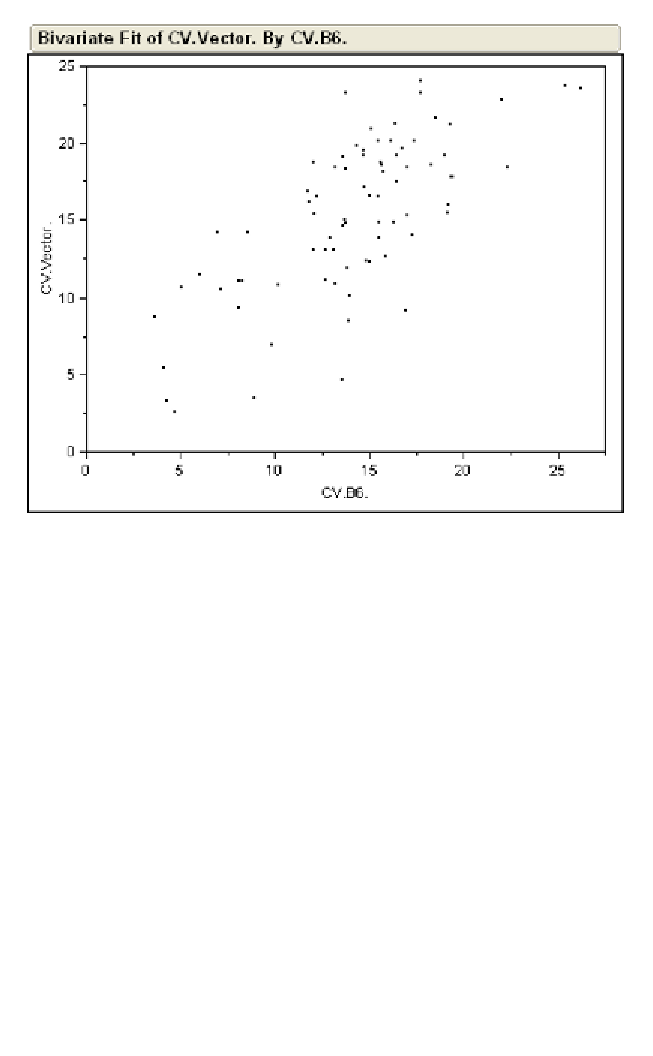
Fig. 3.14. Mean coefficient of variation for sample group B6 versus mean coefficient
of variation for sample group Vector.
Differentially expressed genes are declared at an FDR
q
-value threshold
of 0.05. Due to the stringency of FDR, a lower threshold,
q
<
0.1, was
selected to identify differentially expressed genes.
iterPLIER summary
Table 3.4 shows the number of differentially expressed probes at vari-
ous
p
- and
q
-value thresholds for the contrast using iterPLIER-
processed data. Differentially expressed genes are declared at an FDR
q
-value threshold of 0.05. Due to the stringency of FDR, a lower thresh-
old,
q
<
0.1, was selected to identify differentially expressed genes.
3.4.2.3.
Volcano plot
Volcano plots in Figs. 3.12 and 3.13 show the relationship between fold
change and the level of significance as represented by the
F
1
test statistics,

Search WWH ::

Custom Search