Biology Reference
In-Depth Information
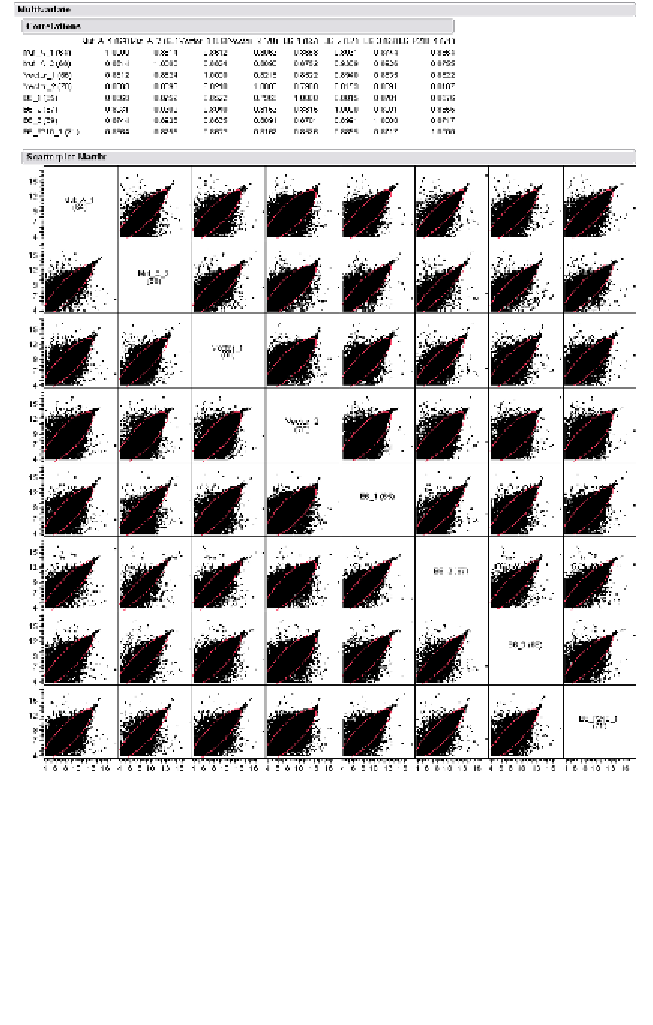
Fig. 3.7. Scatterplots of iterPLIER-processed, normalized intensities for each sample
against all other samples.
3.3.1.1.
Raw intensities for arrays containing a saturated probe
A boxplot of raw and log
2
-transformed intensities for all probes for arrays
containing a probe with an intensity reading
60 000 reveals whether a
probe is an outlier or if an array has consistently high readings (Fig. 3.1).
>


Search WWH ::

Custom Search