Biology Reference
In-Depth Information
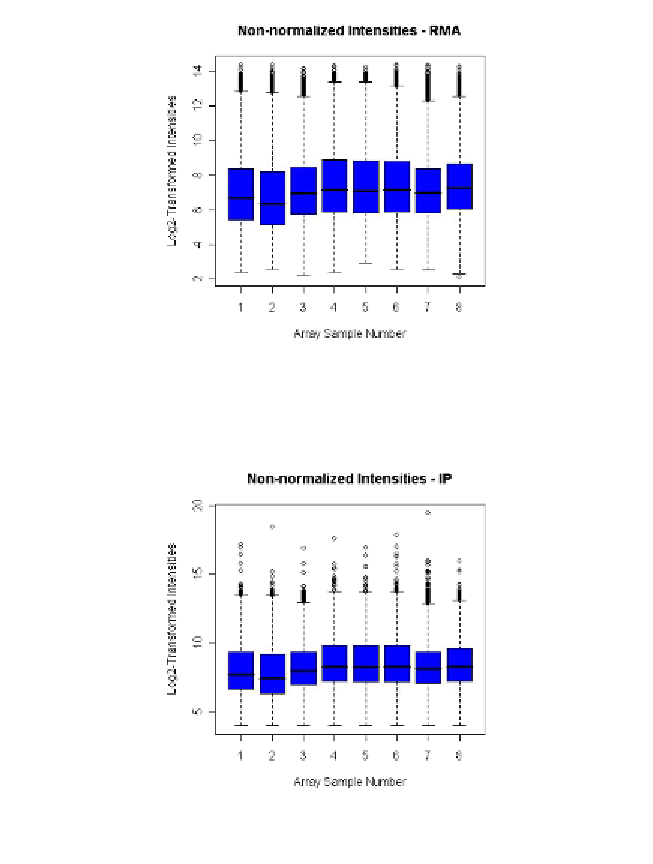
Fig. 3.2.
Boxplot of log
2
-transformed, RMA-processed probe intensities for all
samples.
Fig. 3.3.
Boxplot of log
2
-transformed, iterPLIER-processed probe intensities for all
samples.
of the pairwise comparison will be calculated by permutation analysis
(1000 permutations) and adjusted for multiple testing using the false dis-
covery rate (FDR),
q
-value, method (Storey, 2002). Differentially
expressed genes are declared at an FDR
q
-value threshold of 0.05.


Search WWH ::

Custom Search