Biology Reference
In-Depth Information
Table 3.2. Individual probes with an intensity reading
exceeding that of the saturation of the scanner (
>
60 000).
ID
Probe
Row
Intensity
GC_Gene1.0ST_GES08_0065_040208_1
10387588
12
165140
65533
10599607
32
785261
65534
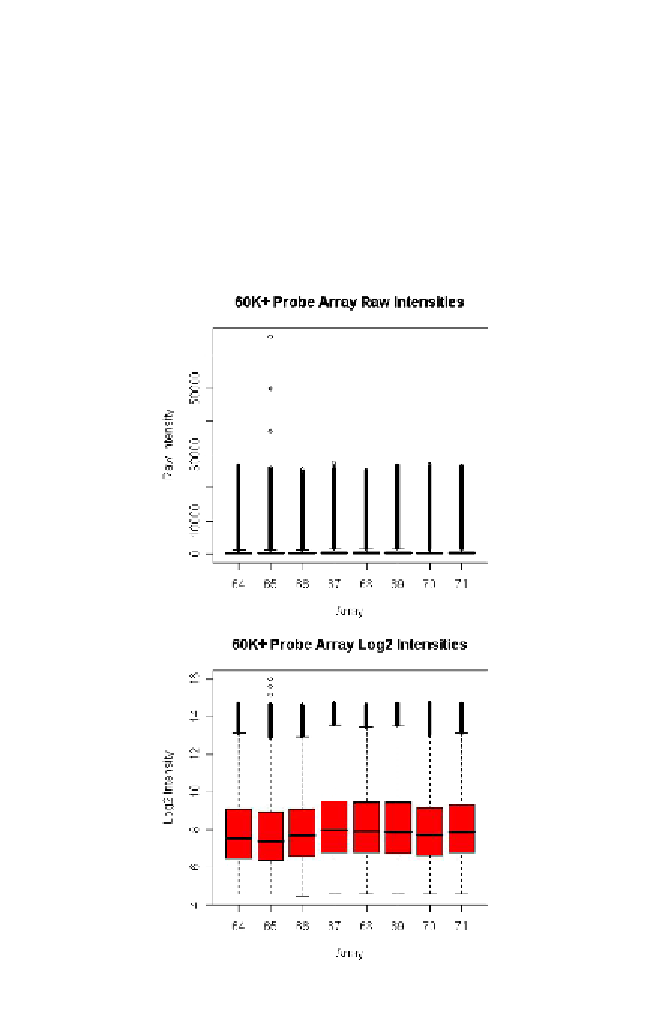
Fig. 3.1. Boxplots of raw (top) and log
2
-transformed (bottom) intensities for all
probes on all arrays.


Search WWH ::

Custom Search