Information Technology Reference
In-Depth Information
Scenario
Subsidies
Self-supply coefficient
Delay
Promotion factor
Population
1
1000
1,3
1
0,8
2M
2
3000
1,3
1
0,8
2M
3
1000
1,2
1
0,8
2M
4
2000
1,2
1
0,8
2M
5
2000
1,2
36
0,8
2M
6
2000
1,2
12
1
2M
7
2000
1,2
12
1
2.05M
8
2000
1,2
12
1
2.1M
Table 1. Values for particular scenarios considering amount of subsidies, self-supply
coefficient, delay which represents to what proportion self-supply of organic farms should
be considered.
20.000
80.000
4
6
7
8
1
2
3
4
5
4
1
15.000
6
7
3
75.000
4
3
1
2
1
2
3
6
7
8
6
7
2
1
2
1
3
5
6
7
5
8
5
4
3
10.000
6
7
8
70.000
8
5
5
8
8
5
8
5
8
3
4
5
5
5
3
6
7
6
7
8
1
1
2
1
2
1
5.000
2
65.000
7
2
3
7
6
3
4
1
4
1
2
3
4
5
3
4
6
0
60.000
0
20
40
60
80
100
0
20
40
60
80
100
Time
Time
20.000
6
800
6
7
8
15.000
4
4
600
6
7
8
3
4
3
4
4
6
7
3
8
400
10.000
3
3
6
3
7
8
7
6 7
8
8
4
6
7
3
3
5
8
6
4
5
200
3
8
1
2
3
4
5
6
7
8
5
5
4
6
5.000
1
2
1
2
1 2
1
6
6
7
8
2
5
2
1
2
6
7
8
2
1
2
3
4
1
2
5
5
1
1
1
2
3
4
5
0
1
5
0
10
20
30
40
50
60
0
20
40
60
80
100
Time
Time
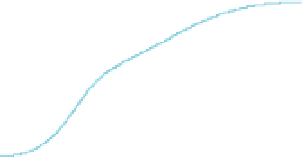
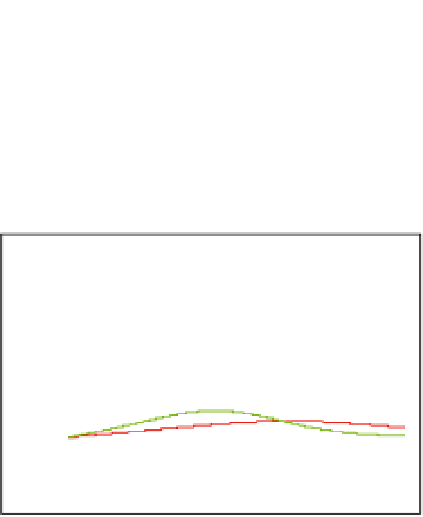
Fig. 5. Example of seven performed scenarios showing dynamics of Eco farms, Conventional
farms, Transitions and Self-organizing support resources
As the mean of concept validation the results of agent-based model are shown in the
following section. Tab. 2. shows list of parameter values for Agent Based Model for four
different scenarios which are performed as the demonstration of how future Agent Based
Model should be implemented.
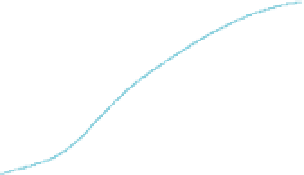
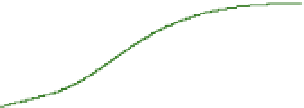
Figure 6 show the results of first simulation scenario SCA1. At the beginning the transition
is started with low gradient until, on account of promotion, the gradient increases as well as


Search WWH ::

Custom Search