Information Technology Reference
In-Depth Information
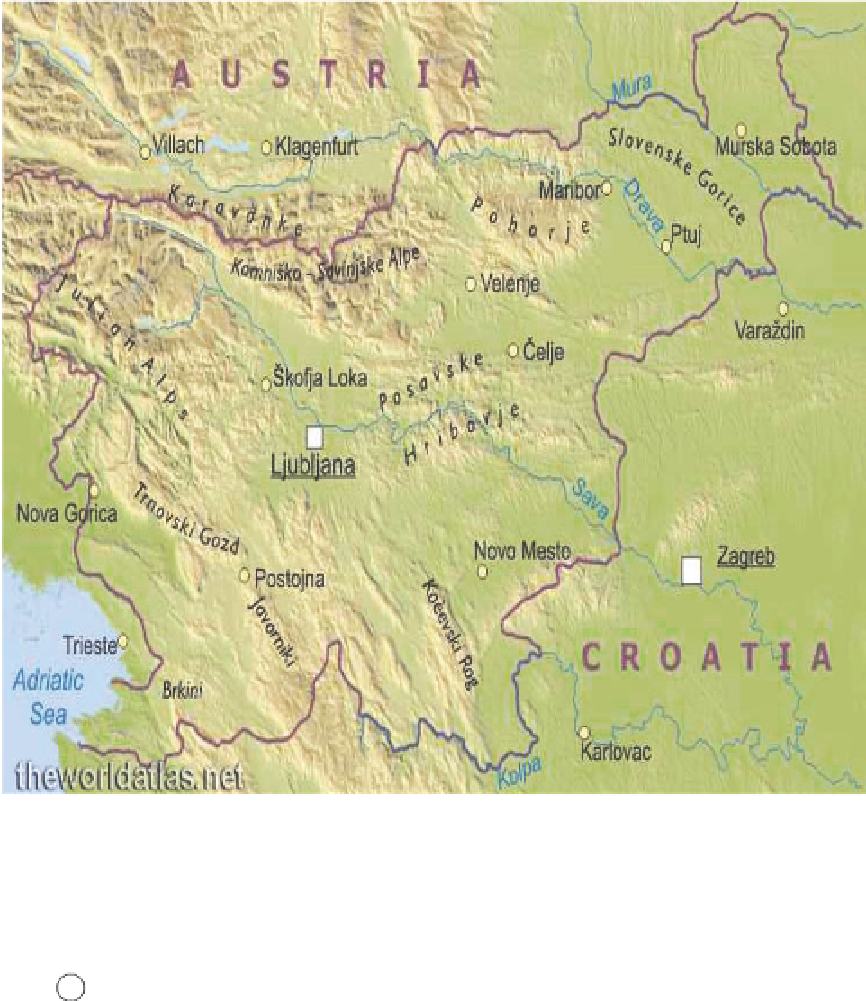
Fig. 1. Map of Republic of Slovenia (relief)
At the development of the causal loop diagram (Fig. 2.) as the first step of the development
of SD model the following key variables were identified:
1.
the number of potential candidates (farms) for conversion to organic farming
2.
the number of farms converted to organic farming
3.
the flow between (1) and (2): conversion rate (transition)
Loop
A
represent negative loop with the goal value of 0 (depleting the number of
“Conventional Farms”). Number of “Conventional Farms” divided by the “Total Number of
Farms” yields the “Concentration of Conventional Farms” which is initially high meaning
that there should be high initial preference for “Conversion”. “Concentration of
Conventional Farms” therefore positively influences the “Communication”. This variable
represents the general communication between the conventional approach members and
organic approach members. “Conversion” positively influences on the number of “Organic
Farms”. If the number of “Organic Farms” increases, the “Information Spread” increases
above the level that would otherwise have been. “Information Spread” by “Organic Farms”
member is positively influenced by the “Information Spread Factor” which could be for

Search WWH ::

Custom Search