Information Technology Reference
In-Depth Information
Binary logistic regressions results in a value between 0 and 1. Discrimination of individual
cases in two classes is done by definition of a “cut-off” threshold. Depending on the “cut-
off” the following classification of the cases is defined:
true negative: cases correctly classified in early onset (model specificity)
false negatives: the values of early onset were classified in late onset (underestimation)
true positive: cases correctly classified in late onset (model sensitivity)
false positives: the values of late onset were classified in early onset (overestimation)
The cut-off value is simply chosen mathematically or graphically so that the rate of false
positives and false negatives is minimized (Hadjicostas, 2006). The model validation is done
using a ROC (Receiver Operating Characteristic) curve (Madden
, et al.
, 2008).
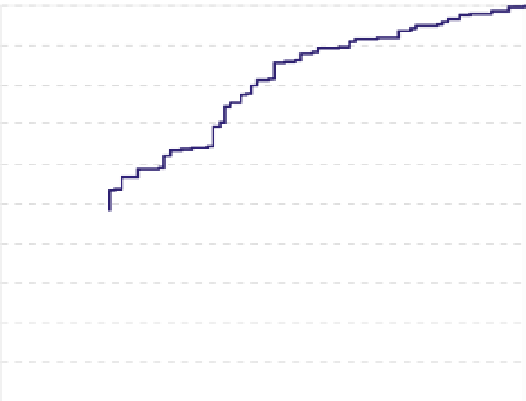
In a ROC curve the true positive rate (Sensitivity) is plotted in function of the false positive
rate (1-Specificity) for different cut-off points of a parameter. Each point on the ROC curve
represents a sensitivity/specificity pair corresponding to a particular decision threshold.
The area under the ROC curve is a measure of how well a parameter can distinguish
between two diagnostic groups (Fig. 6).
1
AUC = 0.73
0.9
0.8
0.7
0.6
0.5
0.4
0.3
0.2
0.1
0
0
0.2
0.4
0.6
0.8
1
1-Specificity
Fig. 6. ROC Curve for the Model ERYBET1 discriminates an early or late powdery mildew
onset in sugar beet
Accuracy is measured by the area under the ROC curve (AUC). An area of 1 represents a
perfect test, an area of 0.5 represents a worthless test. A rough guide for classifying the
accuracy of a diagnostic test is the traditional academic point system: 0.9-1 = excellent; 0.8-
0.9 = good, 0.7-0.8 = fair, 0.6-0.7 = poor, 0.5-0.6 = fail.
Since the AUC of the ERYBET1 model is equal to 0.73 it is statistically acceptable.
Furthermore, with a cut-off equal to 0.74 (estimated to obtain for the model a weighted
combination of specificity and sensitivity) the values shown in Table 5 are obtained for the
classification of the onsets. The percentage of correct classification is about 65% of all cases.
The underestimations were less than 35% and so the model is considered a good estimator
of the early or late onset of disease dependant only on winter weather conditions.


Search WWH ::

Custom Search