Information Technology Reference
In-Depth Information
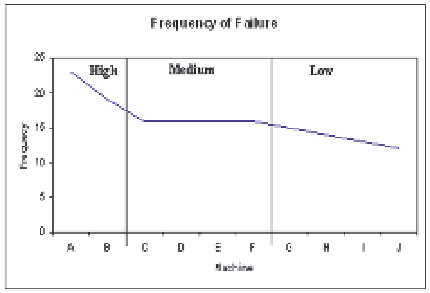
Fig. 2. Frequency of Failure Decision Analysis (Fernandez et al., 2003)
Table 5 shows the level of decision analysis on downtime in hours, from Fernandez et al.
(2003) data using formulas in (4), (5) and (6).
ID
DowntimeLevel
B
64 High
A
32 High
F
29 High
K
28 Low
H
27 Low
L
25 Low
C
25 Low
G
22 Low
D
20 Low
E
20 Low
Table 5. Decision Analysis on Downtime (Fernandez et al., 2003)
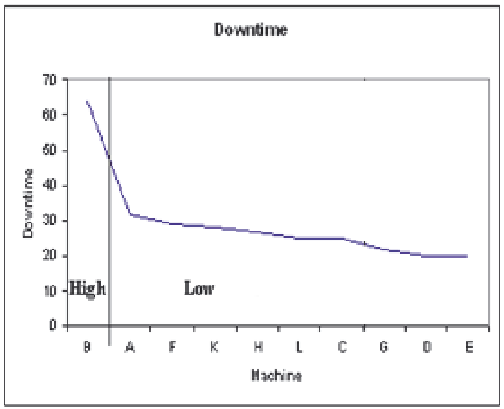
Decision analysis graph on downtime is shown in Figure 3.
Fig. 3. Decision Analysis on Downtime (Fernandez et al., 2003)


Search WWH ::

Custom Search