Environmental Engineering Reference
In-Depth Information
6.7 Emissions
The new oil and gas extraction technologies expand the supplies of oil and
gas, and that lowers the production and consumption of coal. However, the
increases in supplies of oil and gas exceed the reduction in coal production,
and consequently the overall supply of energy increases. This, in turn, in-
creases economic activity, which results in more emissions. The reverse
happens with no expansion in shale oil and gas. In the first experiment the
overall level of CO
2
emissions generated by the US economy decreases by
2.4% due to reductions in supplies of oil and gas during the period 2007-35.
On the other hand, in the second experiment, the overall level of CO
2
emissions produced by the US economy increases by 4.1% due to the ex-
pansion in supply of energy and economic activity. With restrictions on ex-
ports of gas, emissions expand by 6.9% during the period 2007-35. As shown
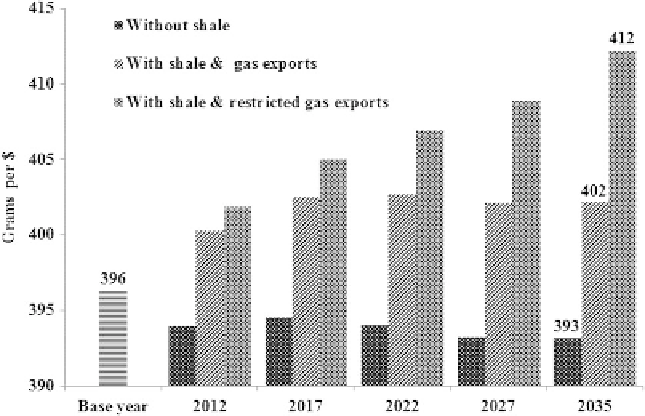
in Figure 5, in the first experiment the index of CO
2
emissions per dollar of
produced commodities (defined as CO
2
emissions over GDP at constant
2007 prices) decreases from 396 g in 2007 to 393 g in 2035. With increases in
supplies of oil and gas, this index increases following a steepening trend and
reaches to 402 g in 2035 in the second experiment. The lower prices of energy
in the second experiment contribute to a higher level of emissions per dollar.
In this case, energy intensity goes up in many sectors due to substitution
between energy and capital and also substitution among capital-energy and
other primary inputs. This leads to a higher level of emissions per unit of
output. Banning exports of gas causes the index of CO
2
emissions per dollar
of GDP to increase to 412 g. This means that if we limit exports of gas then
the energy intensity would increase slightly in future, everything else being
unchanged.
Figure 5 CO
2
emissions per US dollar production at 2007 constant prices.

