Information Technology Reference
In-Depth Information
5.3 Results
Two different experiments were carried out: the first one with 4 agents in the
system, and the second one with 32. Two rounds per experiment were done: one
with classic Q-learning agents (using SSA to represent the environment), and an-
other round with social aware RL agents (also using SSA). In both experiments
we mesured the number of failures and the welfare of the society, for the two types
of agents. Both values are normalized per number of agents. In each figure the two
vertical lines represent the moment in time when a change in the environment was
made.
2
60
Classic RL
Social
Classic RL
Social
1.8
50
1.6
40
1.4
30
1.2
20
1
10
0.8
0
0
50000
100000
150000
200000
250000
300000
0
50000
100000
150000
200000
250000
300000
Simulator Cycle
Simulator Cycle
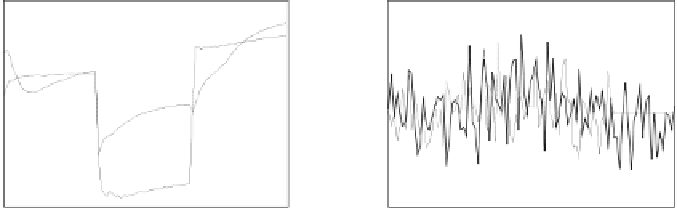
(a) Failures per agent comparison.
(b) Welfare per agent comparison.
Fig. 3.
System with two significant changes. Results using 4 agents in the system.
The
failures
represent agents which were in the system yielding loses -for a
given time- instead of producing welfare. It is the equivalent of business having
loses in the economy: they start with an initial amount of resources but they have
a limited time until they start yielding benefits. Otherwise they would confront
bankruptcy. The lower the number of failures, the better the system behaves as
a whole -it means the system has coped with many different agents and few of
them had problems with their policies.
The
welfare
represent the wealth of the society. The higher, the better. The
final aim of the system is, actually, to produce as much wealth as possible. The
agents -which do not cooperate explicitly, but through their learned policies-
face the problem of concurrency in the environment, hence the fact that the
double the number of agents does not mean the double of wealth.
From the data in figure 3(a) we see that social aware agents are able to cope
with the changes better than the others. The algorithm keeps agents innovative
until they reach a (local) maximum; after this, the agents start adapting their
behavior to the new conditions. Nevertheless, we see in figure 3(b) that the
welfare per agent in the social-welfare society is not much higher than the one in
the non-social. The agents have not found a good policy. Despite the fact that
the number of failures is low, their achievements are not too good. We will talk
about this in a moment after examining the other experiment.
In figure 4(a) it is shown
2
that social agents have fewer failures than non-social
ones. As expected in the theory, the more agents the system has, the easier is to
2
The Y-axis is in logarithmic scale.