Information Technology Reference
In-Depth Information
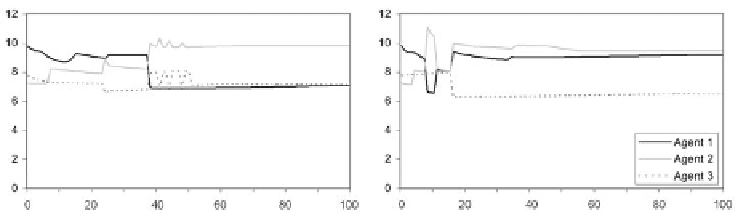
Fig. 2.
The evolution of agent utilities over 100 repeated trials using as a negotiation
outcome: a) the Nash solution; b) the utilitarian solution
fluctuations at the beginning, as agents adapt to their roles and go through non-
equilibrium states. After a while, the total utilities eventually stabilize over some
value. The solutions provided by the Nash and the utilitarian solution can be
different, although usually close, and therefore the obtained equilibrium utilities
are also different.
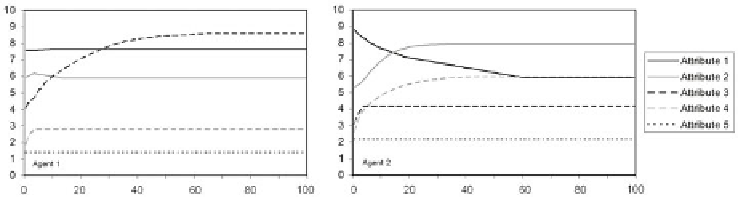
The evolution of attribute utilities of the agents over 100 repeated trials is
displayed in Fig. 3. Since the first two agents have similar initial attribute pref-
erences, it can be seen that the utility of
Attribute 1
is relatively equal at first
and then decreases for
Agent 2
while it remains constant for
Agent 1
. Similarly,
the utility of
Attribute 2
remains relatively constant for
Agent 1
and increases
for
Agent 2
. Both agents find new equilibrium states where they can receive
maximum utility by specializing for different types of tasks.
The total productivity of the system is displayed in Fig. 4. One important
thing to underline is that the system productivity converges to similar values
both when using the Nash solution and the utilitarian solution. The fluctuations
in agent utilities over the learning trials are reflected in the system productivity.
Although the figure shows only 100 epochs, further epochs were considered and
the stable values were found to remain unchanged. While Fig. 4a shows the
results for the simple case study with 3 agents and 10 tasks, Fig. 4b shows the
corresponding productivity evolution with 100 agents and 1000 tasks. In this
case, the search space is huge, but the evolutionary algorithm can be applied in
a straightforward manner, while allowing more individuals (100) and generations
Fig. 3.
The evolution of attribute utilities of two agents over 100 repeated trials