Environmental Engineering Reference
In-Depth Information
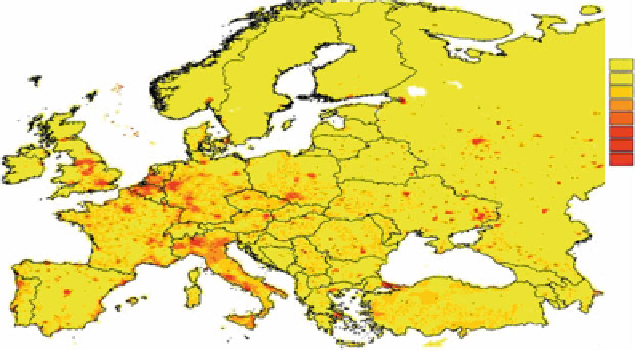
tones / year
0-
10
10-
50
50-
100
100-
200
200-
500
500-
1000
1000-
5000
50000
5000-
Fig. 3.8 Pan-European PM
2.5
emissions [
37
]
Fig. 3.9 Particle emissions
in 15 European Union
states, Iceland, Norway and
Switzerland, in 2005 [
37
]
4.0
1 - Energy transformation
2 - Residential combustion
3 - Industrial combustion
4 - Industrial processes
5 - Prod. & distr. of fossil fuels
3.5
3.0
6 - Product use
2.5
7 - Road transport
8 - Non-road transport
9 - Waste disposal
10 - Agriculture
2.0
1.5
1.0
0.5
0.0
PM2.5
TSP
PM10
and almost equal contributions come from the industrial combustion sector (thermal
and catalytic reformation of hydrocarbons, chemical conversion of coal, syngas
production, etc.), other chemical processes, industrial processing of resources and
the municipal and industrial waste incineration sector.
3.3.1 Stationary Sources of Nanoparticles
As mentioned at the beginning of this chapter, stationary sources of nanoparticles
are industrial thermal power plants, chemical plants producing dust-containing
products like fertilisers or solid pesticides, cement plants and municipal or special