Environmental Engineering Reference
In-Depth Information
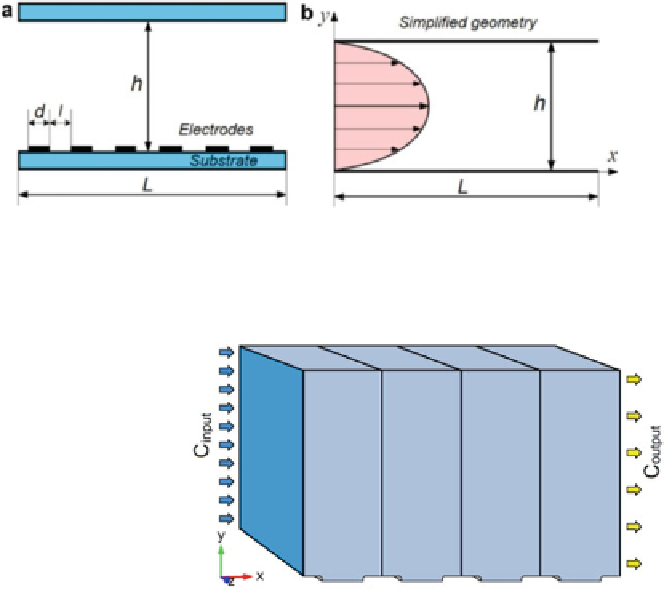
Fig. 14.14 Schematic representation of a dielectrophoretic chamber used for DEP separation (a),
and the simplified geometry used as computational domain for the computation of the concentra-
tion field (b)
Fig. 14.15 Schematic
representation of the
separation device revealing
the parameters used for
defining the
Filtration rate
as presented in Fig.
14.14b
. In the latter case, one can assume that the flow field is
described by a classical Poiseuille profile [
8
].
For a given DEP-force and fluid flow field, the particle concentration is evalu-
ated by numerically solving the equation system (
14.26
)-(
14.27
). This calculated
particle concentration field gives information at a local scale, showing how the
particles are attracted on the margins of electrodes and the influence of the main
parameters of the problem on this process. For the analysis of the filtration process
we define the novel quantity named
Filtration rate
(
F
), which describes the process
in terms of nanoparticles entrapment at the electrodes, related to the concentration
distribution [
49
,
50
]:
C
input
C
output
C
input
F
¼
¼
C
output
=
C
input
½
ð
:
Þ
1
14
28
where
C
input
and
C
output
are the mean concentrations of suspended nanoparticles at
the input and the output surfaces of the device, respectively, as schematically
sketched in Fig.
14.15
.
This proposed quantity gives the global information on the filtration process, and
can be used in order to evaluate the efficiency of the filtration process.