Environmental Engineering Reference
In-Depth Information
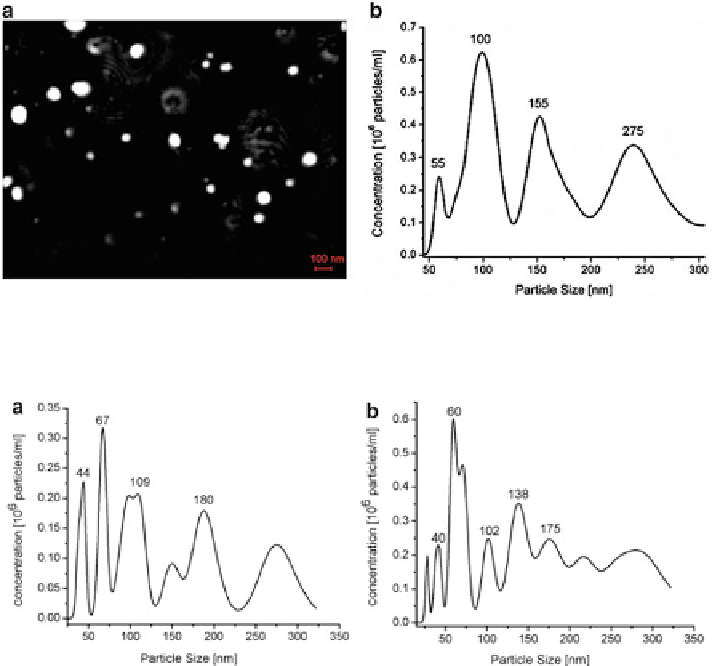
Fig. 14.9 Sample video frame with suspended nanoparticle (a), and the particle size/concentra-
tion distribution diagram (b) for probe A, after 20 min of decantation time
Fig. 14.10 The size/concentration distribution of nanoparticle for probes B and C, obtained with
the visualization system of nanoparticle, Nano Sight LM10, after 20 min of decantation time
than originally detected. For each of the three probes one observes higher concen-
trations for particles with radii of about 50, 100, and 150 nm, values that will be
considered relevant in our future analysis.
14.3.1.2 Dielectric Measurements
The frequency dependence of the real part of the CM factor for the mentioned ash
probes was determined by dielectric measurements, based on the frequency depen-
dence of the complex dielectric permittivity of the probes realized in the frequency
range 25 Hz-2 MHz. The measurements of the real and imaginary components of
the complex dielectric permittivity
, were performed using an
RLC-meter Agilent type E4980A, to which a cylindrical capacitor containing the
analyzed material was connected [
47
]. Figure
14.11
shows the measured frequency
ε
¼
ε
j
˃=ˉ