Graphics Reference
In-Depth Information
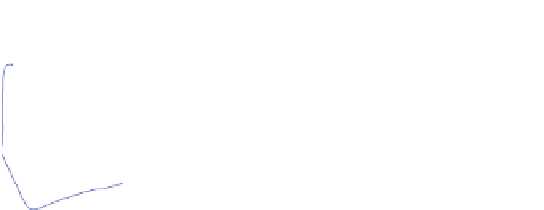
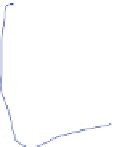
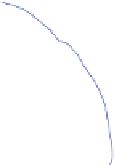
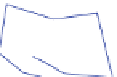
Seq1 Ground Truth
200
0
-200
-400
-600
-800
0
500
1000
1500
X (cm)
2000
2500
Seq2 Ground Truth
Seq3 Ground Truth
1600
800
1400
600
1200
400
1000
200
800
0
600
-200
400
-400
-600
200
-800
0
-200
0
200
400
-600
-400
-200
0
X (cm)
X (cm)
Fig. 2.6
Ground truth trajectories for the test sequences
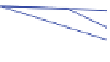
Fig. 2.7
Detail from middle of full and reduced graphs for
. View nodes are (
red
)
circles
,
pose nodes are (
green
)
squares
, and edges are (
blue
)
lines
. Note the reduced density on the
right
Seq2