Graphics Reference
In-Depth Information
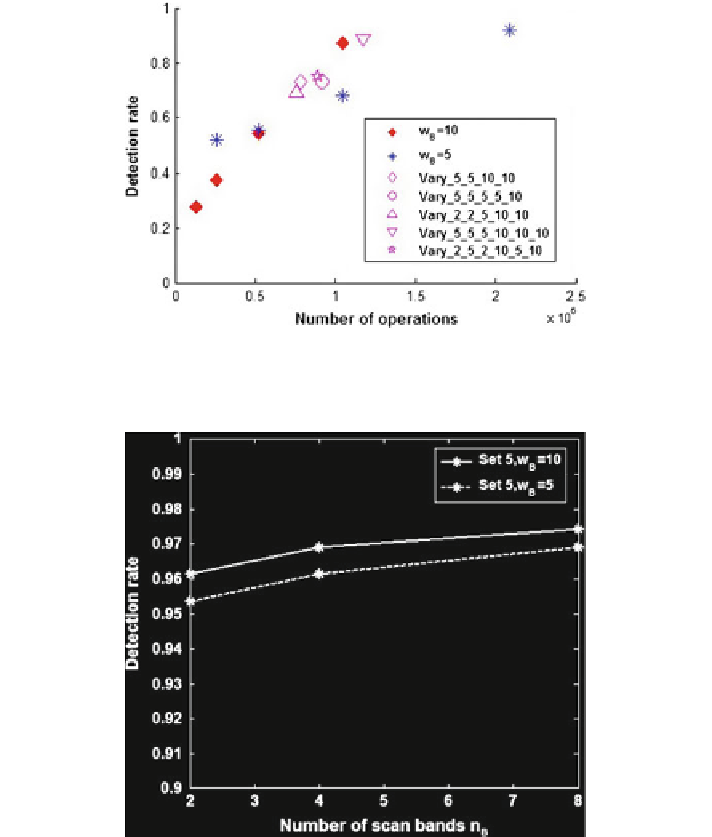
Fig. 10.9
Detection rate versus number of operations with varying band sizes of different scan
bands in the same frame
Fig. 10.10
Detection rate for urban lane scenario with solid lane in Set 5
Figure
10.10
shows the detection rates for varying scan bands to detect solid right
lane in urban road context (Set 5). It can be seen that detection rates of over 90% are
achieved for all band widths and any number of scan bands. Also, the dataset was
chosen such that there are heavy shadows of trees in the images (which usually is the
case in most urban road scenarios). These detection rates imply that it is an overkill
if more than 2 processors are running when the system is detecting solid lanes.
InTable
10.3
, we present possible recommendations of the different configurations
that are possible based on the user requirements, road and environmental conditions.