Graphics Reference
In-Depth Information
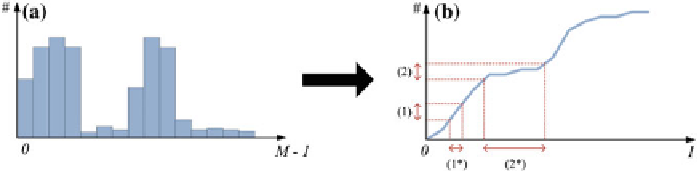
Fig. 6.13
a
Resulting histogram.
b
Corresponding cumulative histogram
H
(
x
)
depth plane numbers. Scene depths of high interest will contain more depth values
than depths of low interest. If there are depths in the scene where no objects are
present, few of this depth values will be available in the depthmap and this is reflected
in the histogram. In the next frame, we want to provide more planes in depth ranges
where a lot of depth values can be found, thus where there are large values in the
depth histogram. The depth planes are not necessarily uniformly distributed, thus the
histogram uses the depth plane number as the bin value, instead of the depth directly.
To use the depth distribution information, we convert the histogram to its cumula-
tive version, as shown in Fig.
6.13
. Here, we do not count the number of occurrences
per depth value, but we rather include the number of occurrences lower than this
depth. Furthermore, we rescale the depth values from
[
D
min
,
D
max
]
, as represented
by the depth plane numbers, to
. This transforms the nonuniform distribution
of the depth planes to actual normalized depth values between 0 and 1. This transfor-
mation generates a monotonically increasing function
H
[
0
,
1
]
]
is a normalized depth value and
y
is the number of values in the rescaled depth
map smaller or equal to
x
. For values of
x
where there are a lot of corresponding
values in the depth map,
H
(
x
)
=
y
, where
x
∈[
0
,
1
(
x
)
will be steep. For values of
x
with a low number of
occurrences,
H
(
x
)
will be flat. Because of the nonuniform depth plane distribution
as input,
H
will be constant at some points where there were no depth planes for
the corresponding normalized depth value.
We use the cumulative histogram to determine a mapping of a plane number
m
with 0
(
x
)
≤
m
<
M
to a depth value
D
m
with
D
min
≤
D
m
≤
D
max
. For a uniform
distribution, this would be:
m
M
(
D
m
=
D
min
+
D
max
−
D
min
)
(6.11)
We adapt this uniform distribution method. When using the cumulative histogram
to determine the distribution, we calculate a fraction
˄
m
∈[
0
,
1
]
based on the plane
number
m
, applied as follows:
D
m
=
D
min
+
˄
m
(
D
max
−
D
min
)
(6.12)
˄
m
is determined by the cumulative histogram. The
Y
-axis is divided
in
M
cross sections, with a distance
The fraction
ʻ
from each other, where
ʻ
=
max
(
H
)/
M
. Each