Graphics Reference
In-Depth Information
(a)
(b)
(c)
Accumulated trajectories
Accumulated trajectories
Accumulated trajectories
45
45
45
40
40
40
Goal
Goal
G
o
al
35
35
35
30
30
30
25
25
25
20
20
20
15
15
15
10
10
10
5
5
5
Start
Start
Start
0
0
0
021150 −
−
−
−
021150 −
−
−
−
021150 −
−
−
−
y[m]
y[m]
y[m]
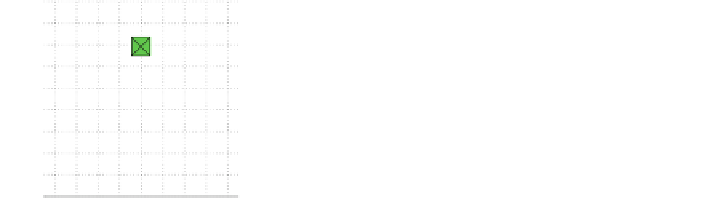
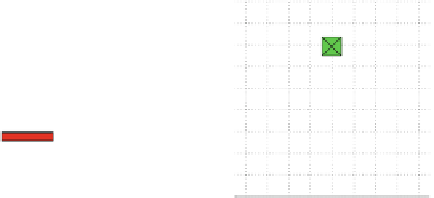
Fig. 4.15
Door experiment:
top-down
view of Monte Carlo simulation with 100 runs with
a
no
pose noise,
b
additive white noise in x and y (
≤
15 cm),
c
random walk bias in x and y (13.4 cm
/
s,
random direction for each run)
This changed when a drifting pose estimate was simulated as shown in Fig.
4.15
c.
To simulate a random walk bias on the position estimates, a fixed position offset of
1
s with a 100 Hz sim-
ulation rate) in a random direction within the x/y plane was defined at the beginning
of each run, and added as a pose offset prior to each planning step. In this experiment,
the vehicle kept a stable orientation to maintain correct heading, which we assume
closely related to real flight experiments, since roll and pitch would be stabilized
around a drift-free gravity vector and yaw can be assumed to be measured locally
drift free by an onboard magnetometer or a vision-aided pose estimation approach.
Since all world point coordinates drift with the amount of bias on pose, the goal
cannot be reached and serves as a desired flight direction indicator.
The vehicle was able to pass the obstacle without a collision in 96 % of all cases.
Collisions only occurred when the vehicle was already within the opening and drifting
sideways, so that the camera could not see the closing in obstruction.
Figure
4.16
illustrates the performance of our navigation system in a real-world
scenario. We implemented our algorithm onboard an Asctec Pelican quadrotor which
was equipped with an Intel Core2Duo, 1.86 GHz processor and conducted flight
experiments in a test forest (Fig.
4.6
).
Our system setup used the sensor fusion approach from [
63
] for pose estimation.
It fuses IMU and position updates from a visual SLAM algorithm (Parallel Tracking
and Mapping (PTAM) [
30
]) that uses images from a downward-looking camera (752
×
.
3 cm (a 10 % drift when operating at maximum speed of 1
.
3m
/
480, grayscale, 100 FOV).
To generate stereo disparity maps, we mounted a stereo camera system [
20
]ontop
of the quadrotor that included an embedded OMAP3730 to off-load the calculation
of real-time disparity maps (376
240, 25 Hz, 12 cm baseline, 110 FOV) from the
main processor, which only performed postprocessing of disparity maps within the
stereo vision pipeline.
In this setup, the pose estimation framework used 59 % of the total resource
(camera and PTAM (30 Hz) 48 %, pose filter (30 Hz) 11 %), stereo postprocessing
×