Biology Reference
In-Depth Information
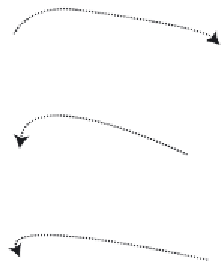
A
G1
G3
G2
p1>p2>p3
B
G1
G3
G2
p2>p3>p1
C
G1
G3
G2
p3>p2>p1
D
G1
G3
G2
(adapted from Kupiec, 1983, 1996)
F
IGURE
30. Model of stochastic gene expression.
The regulator can interact to acti-
vate G1, G2 and G3, with the probabilities p
1
, p
2
and p
3
respectively. These three
probabilities are not equal. They depend on the position of the regulator and the
relative distance separating the three genes.
reproduced. There is a probability of it translocating from its new
position onto one of the two other genes depending on their relative
positions. For example, when it is on G2, the highest probability is
of it translocating onto G3 as the latter is closest (Fig. 30C).
Similarly, when it is on G3, the highest probability is of it translo-
cating onto G2 (Fig. 30D). The relative position of the genes deter-
mines the translocation sequences of
R
, and thus activation of the
genes which have the greatest probability of being expressed. In our
example, the sequence G1
→
G2
→
G3 is the most probable, but
other sequences (G1
G1 etc.) are equally
possible though less probable. In a given cell, these sequences deter-
mine the chronological sequence for expression of the genes. In a
population of cells, the probabilities of expression of the genes asso-
ciated with these sequences determine at a given moment the sta-
tistical frequencies of cells which express one of the three genes.
→
G3
→
G2, G1
→
G2
→