Geography Reference
In-Depth Information
management applications? The simple answer is 'no' - for
several reasons.
First, the metrics classically used to assess 'accuracy'
of remote sensing data might not be entirely appropriate
(Marcus et al., 2003, Legleiter et al., 2011). Standard meth-
ods of characterising accuracy in remote sensing assume
the ground data are correct. Differences between ground-
based and remote sensing results thus are assumed to
represent error in the remote sensing. But what if the
remote sensing data is actually more reliable and infor-
mative than the ground data? Marcus (2002) and Legleiter
et al. (2002), for example, argued that their remote sens-
ing maps of biotypes were more accurate than their field
data. This was because surveyors on the ground combined
large sections of river into one unit (e.g., a riffle), even if
'mini-glides' were present within the riffle. In contrast, the
high spatial resolution imagery would also map most of
that same unit as a riffle, but also map some pixels as glides
depending on local variations in surface turbulence and
depth. In this case the remote sensing imagery is probably
more
precise
in its mapping of fine resolution features.
The determination as to whether the remote sensing map
is more or less
accurate
depends on whether you are a
detail-oriented 'splitter' or a 'lumper' focused on the big
picture; others may be more comfortable representing
this kind of natural variability using fuzzy approaches,
as described by Legleiter and Goodchild (2005). Similar
arguments can be made regarding remote sensing maps
of wood and bed sediment size.
2.13 Accuracy
Remote sensing results are almost always less than 100%
accurate when compared to ground data. In fact, the
large majority of the
highest
accuracies achieved with
remote sensing of rivers range between about 75 and
90% (Tables 2.1, 2.2 and 2.3). Accuracies are limited to
less than 100% due to the previously discussed obsta-
cles that are specific to individual applications, as well
as a number of issues common to most optical remote
sensing projects. These 'generic' issues are summarised
in Table 2.4 and discussed in more detail by Aspinall
et al. (2002), Legleiter et al. (2002, 2009) and Marcus and
Fonstad (2008). Figure 2.5 shows how the optical envi-
ronment can vary over short distances with viewing angle
and location, highlighting some of the issues identified in
Table 2.4.
In addition, certain river settings do not work well
for optical remote sensing. In particular, high energy and
small headwater streams tend to have the view of the water
column obscured by turbulent flow, in-channel features
like boulders and wood, and overhanging vegetation. In
addition, the small size of these streams means that very
fine resolution imagery is necessary to capture the fine
scale of variations in the stream (e.g., the rapid transition
from a step to a pool in a step-pool system).
Do these levels of uncertainty mean that remote sens-
ing results are too fraught with error to be useful for
(a)
(b)
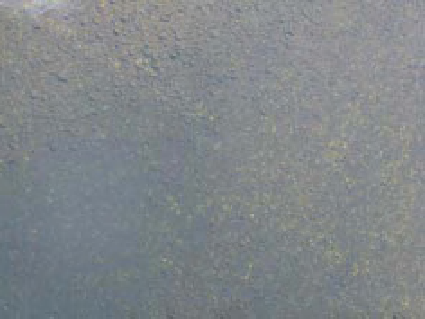
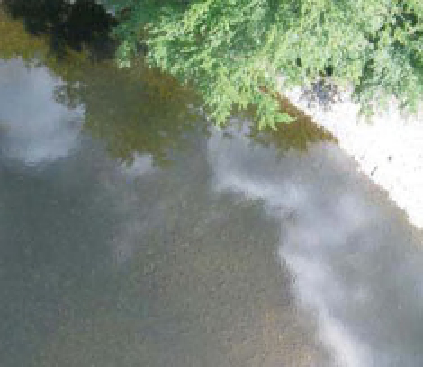
Figure 2.5
Photos from a bridge over the Garry River below Killecrankie, Scotland, demonstrating how the optical environment can
change dramatically over short distances (Table 2.4). (a) Looking upstream, portions of the river are obscured by trees, shadows alter
the lighting in some areas, and reflections obscure features. (b) Looking downstream from the same bridge at approximately the same
photo scale, the different viewing angle enables the camera to readily captures variations in depth and substrate color and size.


Search WWH ::

Custom Search