Geography Reference
In-Depth Information
with warm and
bright colours
with
sediments
without bad structured
aquatic vegetation
with grey or
brown dominance
without
muddy water
without green
dominance
F1
F1 - 37.86 %
without grey or
brown dominan
c
e
with green
dominance
without warm and
bright colours
with
muddy water
without
sédiments
with bad structured
aquatic vegetati
o
n
Figure 18.7
Multiple Correspondence Analysis (MCA) performed on six dichotomous variables describing waterscapes (green
dominance, grey dominance, muddy water, warm or bright colour, presence of sediment, presence of badly structured aquatic
vegetation) and 34 photographs. We showed here the position of the variables (a) and the photographs (b) on the first
factorial map.
The perception of water therefore depends on the
water level or water velocity (Burmil et al., 1999). Litton
(1984) observed photographs taken at various flow lev-
els along two California rivers and concluded that the
aesthetic quality was diminished at both flood stage and
lowest flow stages. Too much water masks the riffle-pool
sequences, reduces the apparent differences of velocity,
and drowns both islands and sandbars. Too little water
gives the impression of a uniform, monotonous flow,
and diminishes riverscape vividness because of the loss
of white water. In shallow waters, the substrate and the
aquatic vegetation are visible and make the signal received
by the eye more complex (Smith et al., 1995b). Decreases
in scenic beauty are linked to the percentage of the scene
in exposed river bed (Brown and Daniel, 1991). Literature
consistently indicates a nonlinear relationship of attrac-
tiveness to flow (Pfl uger et al., 2010). On the Cache La
Poudre River (in northern Colorado), Brown and Daniel
(1991) estimated an optimum flow range (31-42 m
3
/s)
for scenic beauty. They found an inverted U-shaped distri-
bution: perception of scenic beauty is negatively affected
10
9
8
7
6
5
4
3
2
1
0
0123456789 0
Observed note
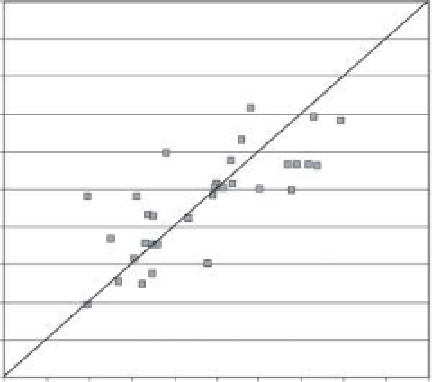
Figure 18.8
Scatter plot of the predictive versus the observed
value of waterscape aesthetics. The predictive value is based on
a multiple regression model performed on the F1 and F2 axes
coordinates shown on Figure 18.7. It has been validated by a
leave-one out procedure. Each grey square is a photo.


Search WWH ::

Custom Search