Geography Reference
In-Depth Information
q
q
1
g
f
2
o
h
f
1
j
e
s
l
m
t
a
2
a
1
n
1
n
2
c
k
p
In-lever (jaw close)
i
b
d
d
2
Out-lever
r
1
r
2
In-lever (jaw open)
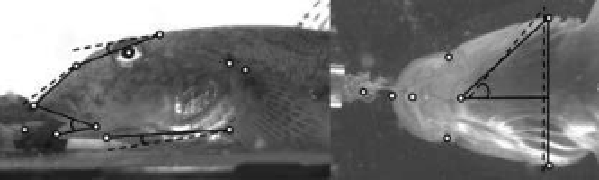
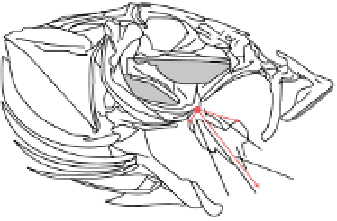
Figure 17.9
Left: Out-lever and in-lever arms for jaw opening and closing in the cranial skeleton of the Hawaiian gobiid fish Awaous
guamensis. Right: Lateral and ventral views of Awaous guamensis, illustrating 11 lateral and eight ventral anatomical landmarks and
angular excursions between vectors formed by landmark points. Dashed lines represent positions of corresponding lines (solid lines)
when each element is further expanded toward full opening of the mouth. Reproduced from Maie, T. et al. (2009) with permission
from John Wiley & Sons, Inc.
environments. Over time, many methods have been
developed to enumerate microscopic organisms, of which
epifluorescence microscopy has become the principle
method for direct enumeration of bacteria without culti-
vation (Kepner and Pratt, 1994). Utilising this approach,
bacteria can simply be differentiated from detritus by
colour segmentation (Shopov et al., 2000 and see para-
graph. 17.4.2). In some studies, the combination of epi-
fluorescent microscopy and IA has been used to speed up
sample processing and to support differentiation between
heterotrophic and autotrophic filaments (see Massana
et al. 1997 for a calibration of these techniques). Cynobac-
teria total filament length can be measured and Walsby
and Avery (1996) developed an IA method for correcting
errors arising from the orientation, crossing and overlap-
ping of filaments. However, biovolume was shown to be
a better measure of biomass than cell number or length.
To estimate the biovolume of filtered bacterioplank-
ton, Krambeck et al. (1981) developed a semi-automatic
system that assisted cell size measurements on images:
bacterial length and width were manually marked by a
cursor on the image and coordinates were directly trans-
ferred to the computer. Fry and Davies (1985) stated
that the optimum technique for measuring volumes of
planktonic bacteria was to filter acridine orange stained
bacteria through polycarbonate membrane filters, to pho-
tograph them with epifluorescence microscopy and then
to estimate volumes from individual area and perime-
ter measurements (using IA). Following this technique,
Bjørnsen (1986) revealed an empirical conversion factor
from bacterioplankton biovolume to biomass.
During epifluorescence microscopy, halation can bias
the automatic estimations of cells size and shape. To avoid
this problem, Tani et al. (1996) suggested the use of a
scanning electron microscopic for IA to measure bacterial
Publisher's Note:
Image not available
in the electronic edition
Figure 17.10
Freeze fractured and -etched cyanobacterial cell.
A discontinuity in the S-layer lattice structure is visible
(arrowheads). The large arrowhead indicates the shadowing
direction. Scale bar
200 nm. Reproduced from Schultze-Lam,
S., Harauz, G., Beveridge, T.J. (1992) Journal of Bacteriology
174(24): 7971-7981, with permission from American Society
for Microbiology.
=
regularly arranged nucleation sites for the critical initial
events in the mineralisation process. Utilising automated
IA, Statzner et al. (2009) described features of mineral
grains in the pupal cases of lotic hydropsychids (e.g.
number, area, shape and mass) and suggested that such
characteristics could be related to forces deforming cases
to fatal levels for the builder/occupant.
17.3 Abundance and biomass
Quantification of bacterial and viral cells is essential
for understanding the role they play in diverse aquatic


Search WWH ::

Custom Search