Geography Reference
In-Depth Information
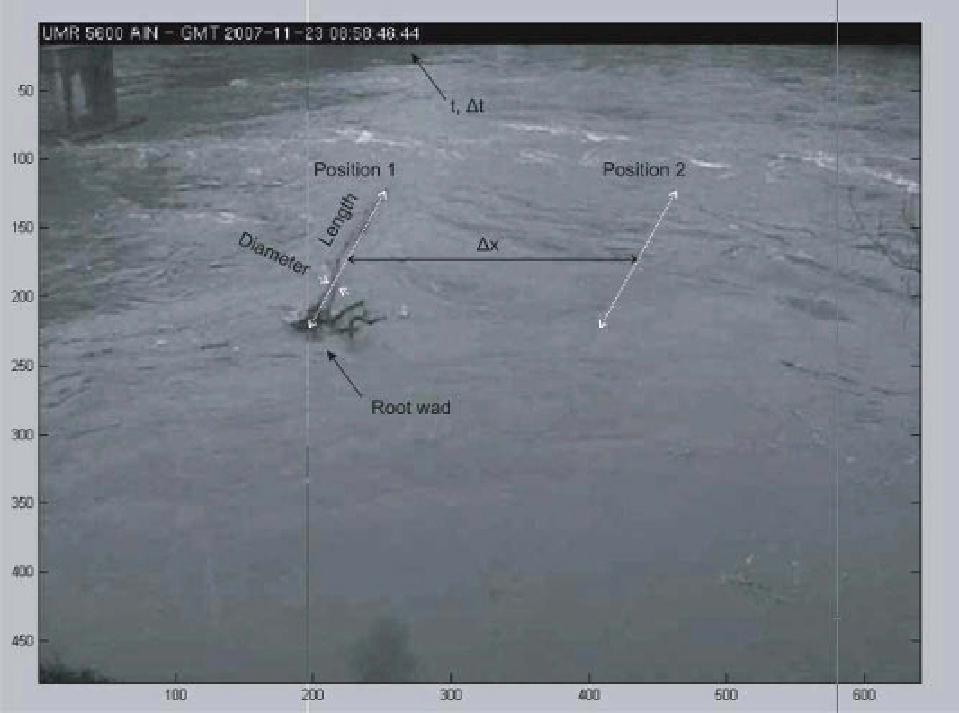
Figure 16.6
A greyscale video frame from the camera on the Ain River. A piece of floating wood is shown at Position 1. The length,
diameter, and position 2 of the wood piece are shown to demonstrate the calculation of wood volume and velocity from the
semi-manual image analysis procedure.
automatic computer algorithm was developed to process
the videos and calculate wood transport frequency. The
automatic detection algorithm and results are described
in the following sections.
16.5.4 Imagesegmentationandanalysis
Seven video segments (total duration of 36 minutes) were
used to develop an algorithm to detect and count wood
objects on the surface of the river. This algorithm was
developed by breaking the larger problem into three tasks:
1) detection and recognition of objects on water surface
(image segmentation); 2) agglomeration of objects in
close proximity into a single object; and 3) distinction
between wood and other types of objects such as water
waves (Ali and Tougne, 2009) (Figure 16.8).
16.5.4.1 Detection and recognition of objects
Histogram thresholding is among the most popular tech-
niques for identifying objects (segmentation) in grey-level
images (Fu and Mui, 1981, Pal and Pal, 1993). Using this
technique, histograms of the grey-level image intensity
are calculated and regions with similar values are iden-
tified as objects or regions within the image. The Fisher
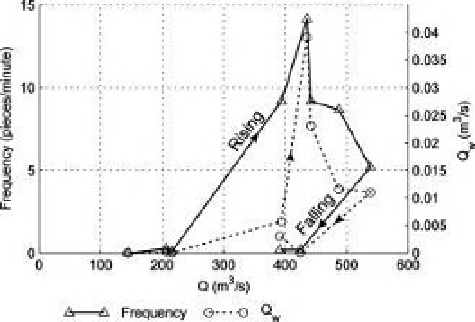
Figure 16.7
Wood frequency and volume as a function of
discharge for a flood on the Ain River.
Search WWH ::

Custom Search