Geography Reference
In-Depth Information
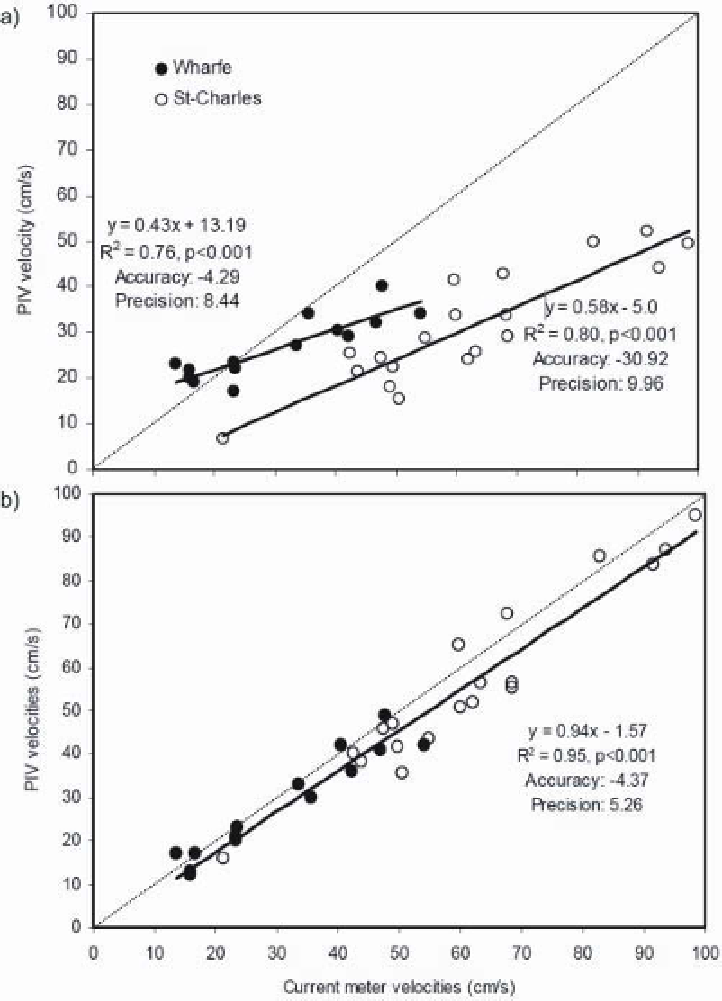
Figure 16.5
Comparison between current meter measurements and time-averaged LSPIV estimates in the River Warfe and the St.
Charles River: a) unfiltered LSPIV data; and b) filtered PIV data.
Wharfe due to a high-suspended load. Flare effects were
observed at both sites but were more pronounced on
the St-Charles River due to the clear sky conditions
that favoured the reflection of sunlight on the water
surface.
Post filtering, the PIV measurements of both sites
showed a strong and significant relationship with cur-
rent meter measurements, with slope values approaching
one (River Wharfe, R
2
St-Charles River, R
2
02).
When combining the two data sets, a strong signifi-
cant relationship (R
2
=
0
.
92, p
<
0
.
001, slope
=
1
.
=
0
.
95, p
<
0
.
001, slope
=
0
.
94)
was obtained between current meter and PIV measured
velocities, with PIV measures showing an accuracy of
−
26 cm/s (Figure 16.5b).
These results are comparable to those obtained by Bradley
et al. (2002) who found differences between PIV and
current meter velocity measurements of less than 6 cm/s.
4
.
37 cm/s and precision of
±
5
.
=
.
<
.
=
.
0
92, p
0
001, slope
0
86;
Search WWH ::

Custom Search