Geography Reference
In-Depth Information
Right bank
Left bank
1.4
0
1.2
−
10
1.0
0.8
−
20
0.6
−
30
0.4
0.2
−
40
0
0
10 20 30 40
Distance from left bank (m)
50
60
70
−
90
−
80
−
70
−
60
50
X (m)
−
−
40
−
30
−
20
(a)
(b)
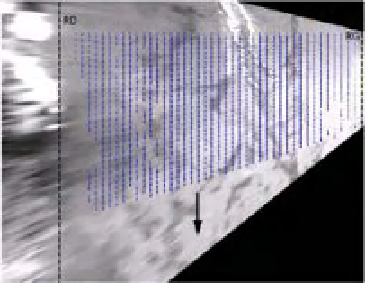
Figure 16.3
a) Ortho-rectified image from Sauze St. Martin showing instantaneous velocity vectors, b) comparison between
corrected LSPIV velocities (solid blue line,
α =
0
.
90) and ADCP depth-averaged velocities (dashed lines, with
±
10% interval).
of approximately 300m
3
/s. This value was consistent
with a larger sample size of 29 current-meter gaugings
conducted at Sauze-Saint Martin. This value is thought to
be reasonable given that is close to the 'standard' value of
α =
Table 16.1
Comparison between ADCP/LPIV discharge
measurements and discharges estimated using the rating
curve.
50m
width of the channel and its relatively smooth bed profile,
towards the upper end but within the range identified by
Polatel (2005).
Mean velocities estimated with the LSPIV technique
show good agreement with ADCP measurement
(Figure 16.3). When the LSPIV surface velocities were
corrected by the velocity profile coefficient (
0
.
85 (Costa et al., 2000) and, considering the
>
Gauging
Gauging 1 Difference Gauging 2 Difference
(m
3
/s)
(m
3
/s)
Method
(%)
(%)
Rating curve
320
343
ADCP
327
+
2
.
1
345
+
0
.
6
LSPIV
331
+
3
.
4
336
−
2
.
1
90),
the overall difference between the two estimates was
less that 10% across the entire cross-section. Larger
deviations are visible at distances 0 and 50m from left
side and may be the result of errors in spatial sampling.
A comparison of the discharges estimated from the
ADCP and LSPIV with the discharge estimate from the
established rating curve show that both methods are
close to the rating curve (less than 5% difference) and are
consistent between themselves (maximum difference of
2.6%) (Table 16.1).
On November 23, LSPIV measurements were made
during the peak flow. Due to the very high surface veloc-
ities (up to 3m/s), it was not possible to safely measure
velocities using the ADCP at the same time. From the
LSPIV measurements (
α =
0
.
9), the estimated discharge
was 825m
3
/s - an overestimation of 8% when compared
to the established rating curve (760m
3
/s).
The sources of errors in the LSPIV stream gauging
technique include: image sequences with poor quality
α =
0
.
due to external conditions or instrumental limitations;
an insufficient number of averaged image pairs taken
during a limited time span to avoid significant discharge
variations; possible variability in the velocity index (
α
)as
flow conditions change; possible variability of the cross-
section with stage; and an unquantified effect of using
the Froude-constant technique to interpolate missing or
truncated velocities. Improvements should aim at quan-
tifying and reducing these errors, and defining criteria for
discarding poor quality image pairs.
16.4 Case 2 - Filtering bed and flare
effects from LSPIV measurements
16.4.1 Introduction
The utilisation of LSPIV in the field is complicated by
uncontrolled environmental conditions such as wind and


Search WWH ::

Custom Search