Geography Reference
In-Depth Information
(a)
(b)
(c)
AFDD = 100
°
C
AFDD = 200
°
C
AFDD = 350
°
C
(d)
(e)
(f)
AFDD = 100
°
C
AFDD = 200
°
C
AFDD = 350
°
C
(g)
100
80
60
40
Riffle
Pool
20
0
0
100
200 300 400
Accumulated freezing degree day (
500
600
700
800
°
C)
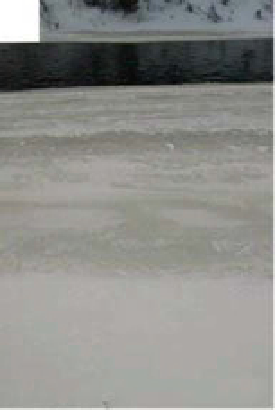
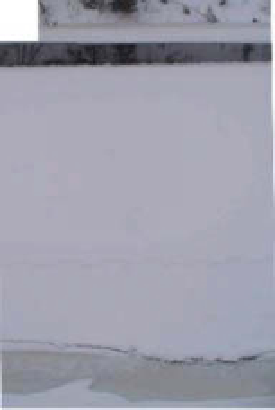
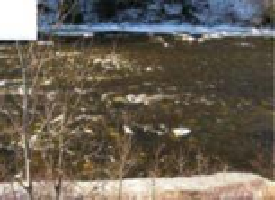
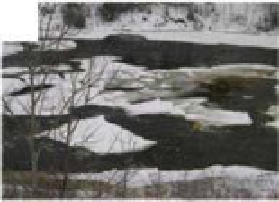
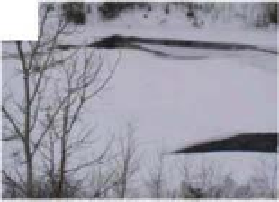
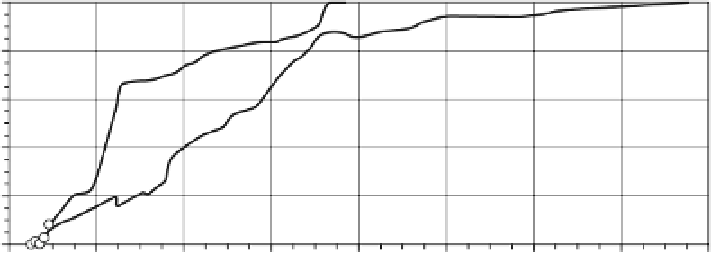
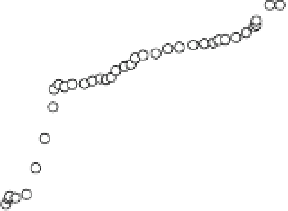
Figure 15.12
(a), (b) and (c) Evolution of an ice cover in a pool. (d), (e) and (f) Evolution of an ice cover in a riffle. (g) Ice cover
growth curves for a pool and a riffle. Curves are obtained from daily pictures taken perpendicular to a riffle and to a pool in the
Rimouski River, Quebec, Canada. AFDD
Accumulated freezing degree day in
◦
C.
=
both morphologies present growth curves with distinct
growing periods. For both morphologies, there is an
initially rapid growth period followed by a slower growth
period leading to the complete closure of the ice cover
(Dube, 2009). There are, however, differences in the
growth rates between the two morphologies, the pool
having higher growth rates and leading more rapidly to
full closure of the ice cover. Combined with qualitative
information from the daily photographs, these curves
are associated with distinct freeze up processes. In the
riffle, frazil ice accumulation and anchor ice dominate
the formation of the ice cover during the early stages but
border ice processes dominate to reach full closure. In the
pool, frazil ice and border ice develop during the whole
growing period.
In this example, the use of daily close-range pictures
helped significantly to document a process that is rather
difficult to measure in any other way. Measurements of


Search WWH ::

Custom Search