Geography Reference
In-Depth Information
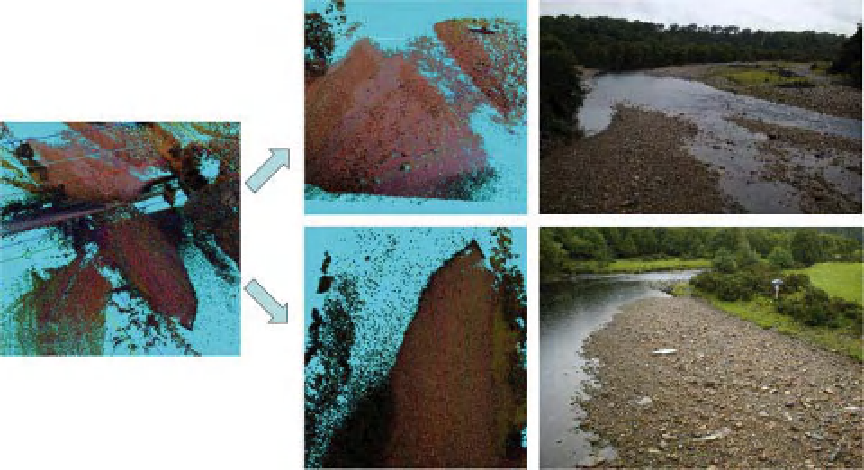
Figure 14.2
Combined laser scan cloud image at the point bar scale demonstrating the utility of oblique laser scan data in defining
gravel surface character. Site scanned is the River South Tyne at Lambley, Northumberland, UK. The bar extends approximately
100m up and downstream and is 30m wide close to the bridge.
defining gravel surface character across a 180m
2
point bar
locatedon theRiver SouthTyne at Lambley, Northumber-
land, UK (Figure 14.2). The site offered excellent visibility
across the surface from a road bridge and also valley
side laser scan vantage points, ensuring that much of the
bar surface was visible at acute scan angles. Scan point
density was thereby maximised and laser pulse footprint
elongation and associated point averaging minimised as
interpolation between points becomes redundant. Mul-
tiple scanning of the surface from the same location also
allowed an averaged scan surface to be computed from
the mean of several scans of the same area. This minimises
any instrument time of flight error.
The final dataset of the 180m
2
bar surface contained
3.8 million points with a mean spacing of 0.012m. Sur-
face points were on average accurate to
by a factor of two to generate the effective roughness
equivalent (Nikora et al., 1998; Gomez, 2003).
Point densities averaging 10 000m
−
2
allowed the sur-
face to be gridded at 0.02m intervals and data were
extracted from the resultant grid for 0.5m
2
sub-areas and
the median and first standard deviation of each sub-unit
were calculated to generate values for D
50
,D
16
and D
84
respectively. These values were re-interpolated to generate
facies maps of the bar surface (Figure 14.3).
Hodge et al. (2009b) have investigated the nature of
gravel surfaces across exposed bar areas on the River
Feshie and Bury Green Brook in the UK, the former being
coarser in nature (Figure 14.4). A Leica HDS3000 laser
scanner was used to collect data from 2m
2
areas of the
bar surfaces with an expected point position precision
of 4mm. Repeat scanning and scan overlap techniques
were employed to further minimise error. Despite these
precautions Hodge et al. (2009b) report erroneous points
(averaging 1.3mm standard deviation across the surface)
across the surface due to instrument error, the size of
the laser footprint and obscured surfaces at certain scan
angles. Hodge et al. (2009b) argue that these errors can be
further minimised using a variety of algorithms designed
to eliminate outliers and smooth surfaces. Despite this
the data were used to resolve individual grain inclination
and orientation parameters enabling the authors to link
this to the macro-morphology of the study sites.
0
.
009m when
compared with 113 independent EDM validation points.
The laser scan data were subsequently used to generate
a 0.05m resolution DEM of the point-bar surface. The
local standard deviation (z) of the elevation data was
calculated within a 0.15m moving window (equivalent
to the measured intermediate axis of the largest visible
clast) The 0.15m radius window was set to move at 2 cm
intervals in plan (x and y) across the point cloud. A z value
was then designated to each grid node, spaced every 2 cm.
The small window size is assumed to be unaffected by
regional surface trends. Each z value was then multiplied
±
Search WWH ::

Custom Search