Geography Reference
In-Depth Information
1
1
0
0
Time
Time
1
1
0
0
Time
Time
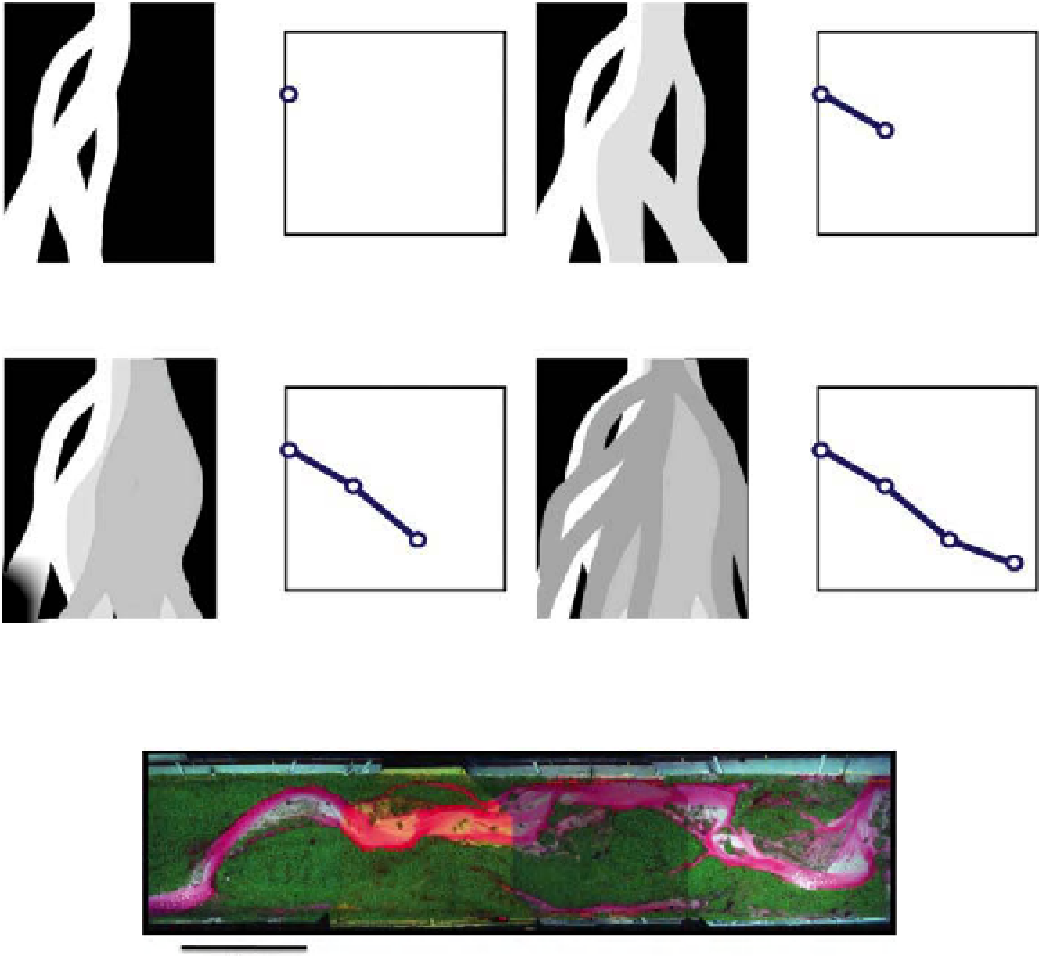
Figure 13.9
XES image analysis showing the evolution of the deltaic surface over a given time interval. White and grey are
respectively the initial wet surface and surfaces that became progressively wet as a result of channel migration. Black is the surface that
remained dry. A faster decay in the remaining dry surface corresponds to stronger channel activity (Kim and Paola, 2007).
2 m
Figure 13.10
Experimental channel at the St. Anthony Falls Laboratory designed to study the interactions between flow and riparian
vegetation (Tal and Paola, 2007; Tal and Paola, 2010). Image is stitched together from four simultaneous time-lapse images.
Rhodamine dye is used to colour the flow.
alternating a long duration state of low discharge (3 - 6
days) during which the channel morphology remained
relatively stable and plants grew on emergent river bars
and banks, and a short-lived flood (typically 1 hour) with
vigorous sediment transport in which physical processes
predominated. Vegetation was added to the experiment
by dispersing seeds manually over the entire bed at the
end of each high flow with the water discharge set to its
low value.
Four digital cameras (Olympus C-4000 Zoom) were
mounted directly above the flume and equally spaced
to capture images of a 10 m long by 2 m wide study
reach (Figure 13.10). The images overlapped by
0.5 m
so they could be stitched together. The cameras cap-
tured images at a resolution of approximately 2 mm/pixel.
Each camera had a polarising filter, and polariser sheets
were hung underneath the halogen lighting to achieve
cross-polarisation and minimise glare from the flow.
∼
Search WWH ::

Custom Search