Geography Reference
In-Depth Information
13.3.1 Experimental deltas
The Experimental EarthScape (XES) facility at the St.
Anthony Falls Laboratory, University of Minnesota is
a research tank designed to study deltaic sedimenta-
tion associated with geological controls, e.g., changes in
sediment supply, subsidence, and sea-level. Premixed sed-
iment and water are introduced at the upstream end of
the flume and flow for a short distance as a fluvial system.
At the downstream end of the tank standing water forces
sediment to deposit and form a delta. The tank is 3 m
wide, 6 m long, and 1.5 m deep. In these experiments
deltas self-organise in response to continuously evolving
fluvial patterns. Details of these experiments can be found
in Kim et al. (2006), Kim and Paola (2007), and Kim and
Jerolmack (2008).
Throughout an experiment images of the evolving delta
are captured every few seconds using an overhead camera.
To better visualise the flow, water is dyed blue and made
opaque by adding titanium dioxide. Flow opacity makes
it possible to easily distinguish areas with active flow
despite the use of two different colours of sediment (in
the XES experiments quartz sand is white and crushed
coal particles are black). Dye in these experiments was
not used for measuring flow depths.
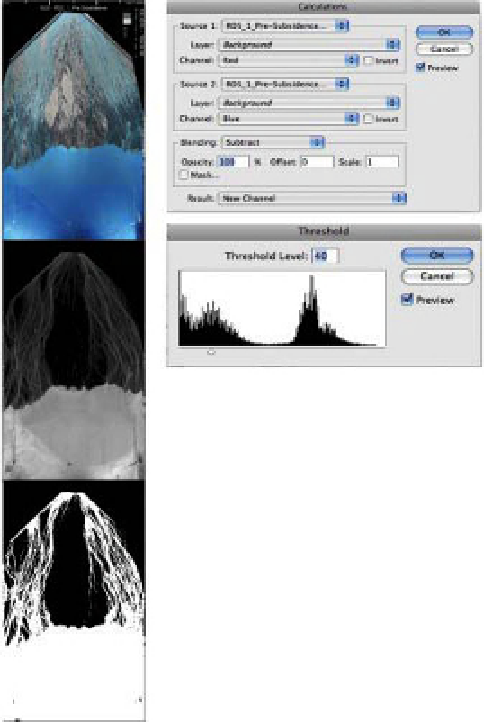
In order to create binary wet-dry images, the contrast
between dry and wet areas was first enhanced by creating
a greyscale image. For this set of images, differencing the
red and blue colour bands produced a greyscale image
that clearly highlighted the regions occupied by flow
(Figure 13.7). This procedure can be done by, for example,
using the 'calculations' option in Abode Photoshop. Once
the greyscale map was obtained, a threshold value was
used to convert the image into white (wet) and black
(dry) - using the threshold option in Photoshop. The user
should be able to identify approximately what flow depth
a particular threshold value corresponds to and justify
why it is an appropriate cutoff. A series of images can be
batch processed once the algorithm has been established.
Analysis of the binary wet and dry images led to
the observation that self-organised (autogenic) sediment
storage and release are associated with changes in river-
planform pattern (Figure 13.8; Kim and Jerolmack, 2008):
the experimental deltas stored much of the sediment
supplied from the upstream input and showed strong
sediment deposition in the deltaic surface when the river
pattern was tabular (i.e., sheet flow which corresponds
to a large wetted fraction of the bed). In contrast, the
delta released sediment stored from the surface through
the shoreline to the ocean when the deltaic channels were
Figure 13.7
Example of an image analysis from the XES
experiment (Kim et al., 2006; Kim and Paola, 2007; Kim and
Jerolmack, 2008). The left image is the original colour image,
the middle greyscale image is the result of differencing the red
and blue colour bands, and the right binary image is based on a
threshold value applied to the greyscale image to distinguish
between wet (white) and dry (black) pixels.
confined to a narrow path and incised (i.e., channelised
flow which corresponds to a small wetted fraction of the
bed). The rate of seaward shoreline migration fluctuated
as a result of changes in the sediment flux being released
from the delta. Autogenic shoreline fluctuation measured
from the images corresponded well with the fraction
of the fluvial surface that was wet - measured from the
binary images.
The analysis of the wetted fraction described above
does not reflect the lateral mobility of a channel (i.e., if
a channel migrates laterally while maintaining a constant
width the wetted fraction remains the same). In order to
characterise channel activity (planform pattern change
+
lateral mobility), Kim and Paola (2007) analysed the wet
and dry binary images in a different way. The analysis
consisted of accumulating the area of the deltaic surface
Search WWH ::

Custom Search