Geography Reference
In-Depth Information
transported as bedload. This technique applies particle
tracking velocimetry (PTV) algorithms commonly used in
studies of fluid mechanics and, more recently, suspended
sediment in flows.
distribution by capturing images at higher frequency or
using two cameras with different fields of view.
Assuming all the particles have the same density (
ρ
),
the mass of each particle is calculated from its vol-
ume (
V
). Particles are described by their three principal
dimensions: minimum diameter (the thickness), medium
diameter (
d
), and the maximum diameter (
D
); the grain-
size of each particle is characterised by the medium
diameter (
d
). If (
v
) is the streamwise velocity of the par-
ticle (in pixels per second) and (
h
) the streamwise length
of the image (in pixels), the total sediment discharge is
the sum of the elementary contribution of each particle :
13.2.1 Image-basedtechnique tomeasure
grainsizedistributionandsediment
discharge
The objective of the technique presented here is to char-
acterise GSD by weight and total sediment discharge
exiting the downstream end of a flume. The methodology
is based on image analysis of sediment in the sand and
gravel size range flowing across a light table (Frey et al.,
2003; Figure 13.1). The equipment required for this tech-
nique are a light table that can be tilted independently
of the flume (in the study described here, this consisted
of an adjustable transparent ramp with a light source
fixed underneath it) and a digital video recorder that can
operate in backlighting mode. The aim is to have particles
move across the table in a single layer with a low number of
clusters and the thinnest possible flow. The tilt of the table
should be adjusted to obtain the smoothest possible flow
and dispersion of particles. For a given sediment concen-
tration exiting a flume, the steeper the ramp the higher the
velocity will be and the lower the number of clusters. In
the experiments described here, the velocity of sediment
moving across the ramp was typically 2-6 m/s. A cam-
era that captured full-frame monochrome images with a
resolution of 640
×
480 pixels and a frequency of 60 Hz
was used (Bigillon et al., 1999). The range of medium
diameters of the particles was initially restricted to about
one order of magnitude, typically 2-20 mm, however
the technique can be used to measure a larger grainsize
ρ ·
V
(
i
)
·
v
(
i
)
Q
s
=
(13.1)
h
i
∈
particles
where
V
(
i
) is the volume of the
i
th particle. This sum
is calculated on all particles for all images. The GSD is
derived from the sum of elementary sediment discharges
relative to one class of medium diameters divided by the
total sediment discharge. If all particles have the same
constant streamwise velocity on the backlit plate, the
problem is simplified to the ratios of the volumes of
particles of one class of medium diameters to the total
volume, i.e.:
V
(
i
)
i
∈
class
(13.2)
V
tot
In this case, streamwise velocity needs to be assessed in
order to calculate total sediment discharge.
Calculating the volume of each particle is central to this
methodology. To do this, image processing algorithms are
first used to estimate the diameters and areas of the par-
ticles in the 2D image. Next, the volume is calculated
Full frame camera
PULNIX 6705
Grabbing
meteor II MC
WIMA
Segmentation
Separation
Geometrical
data
Mean
velocity
Postprocessing
Grain size distribution
Solid discharge
High frequency
backlighting
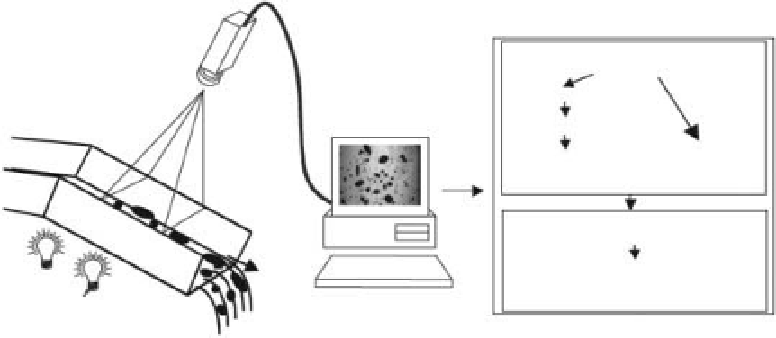
Figure 13.1
Experimental setup and processing chain to characterise the grainsize distribution and sediment discharge exiting the
downstream end of a flume using image analysis of sediment flowing across a light table.


Search WWH ::

Custom Search