Geography Reference
In-Depth Information
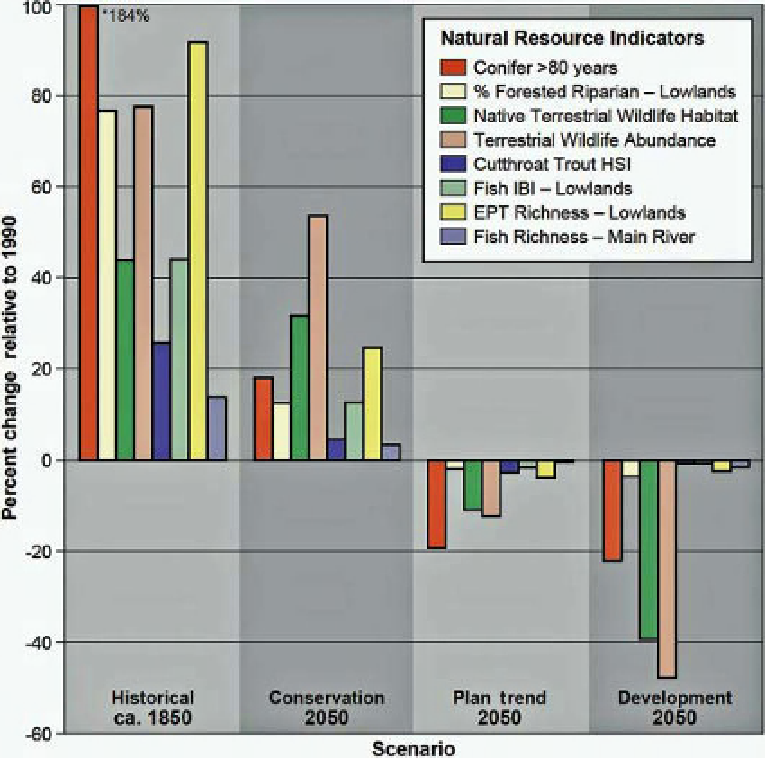
Figure 12.4
Percentage change in selected natural resources indicators in the Willamette River basin. Zero change represents
resource conditions circa 1990. Reproduced from Baker et al. (2004), with permission from the Ecological Society of America.
Federal forest lands are managed by the Northwest Forest
Plan, which established extensive networks of riparian
reserves and late successional forest reserves to maintain
regional biodiversity beginning in 1998. Riparian reserves
account for 11% of the federal forest lands in the WRB,
late successional forest lands account for another 30%,
and wilderness areas and other congressionally withdrawn
lands make up another 30%.
Projected human population growth and implementa-
tion of existing land use regulations resulted in a dramatic
increase in population density within areas zoned for
urban and residential development. Population densities
increased from an average of 9.4 residents/ha in ca. 1990
to 18.0 in 2050 even though the land base for urban areas
and residential areas increased by only 25%. Increased
housing density accommodated the population increases
while protecting more than 98% of the existing farm and
forest land. Though the forest land base did not change
greatly, continued timber harvest reduced the amount of
older forest land (age
>
80 years) by 19% on private and
state forests.
Model projections indicate that land use changes under
Plan Trend 2050 caused relatively small changes in aquatic
communities and terrestrial wildlife (
10% relative to
1990) across the WRB. Local resources and certain species
showed substantial changes, but the change in aquatic and
terrestrial communities from 1990 to 2050 were far less
than estimated losses from historical conditions to the
present (Figure 12.4). Water consumption and water
availability changed greatly because of the doubling of
the human population. With almost a 60% increase in
surface water withdrawals, 20% increase municipal and
industrial uses and doubling of irrigated agriculture, more
than 270 km of 2nd to 4th order streams went dry during
dry seasons in contrast to 130 km in 1990. Oregon Water
Resources Department tracks 178 subbasins for water
∼
Search WWH ::

Custom Search