Geography Reference
In-Depth Information
(b)
1000
(a)
100
Type 1
Type 2
Type 3
Type 4
Type 5
Type 6
Type 7
0
100 km
10
1
10
100
Catchment area (^0.46; km
2
)
(c)
2200
F(Q)
0.98
0.2
2150
km 2000
2100
2050
2000
1950
km 1900
1900
1850
750
850 950
X - coordinates east (km)
(d)
2200
Phreatic sites (Ratio total versus flow lengths)
Braided
types
Catchment
area (km
2
)
2150
1.07
2.11
2100
0 - 50
50 - 100
100 - 250
250 - 500
500 - 1000
1000 - 2000
> 2000
1
2
3
4
5
6
7
2050
2000
1950
1900
1850
750
850
950
X - east coordinates (km)
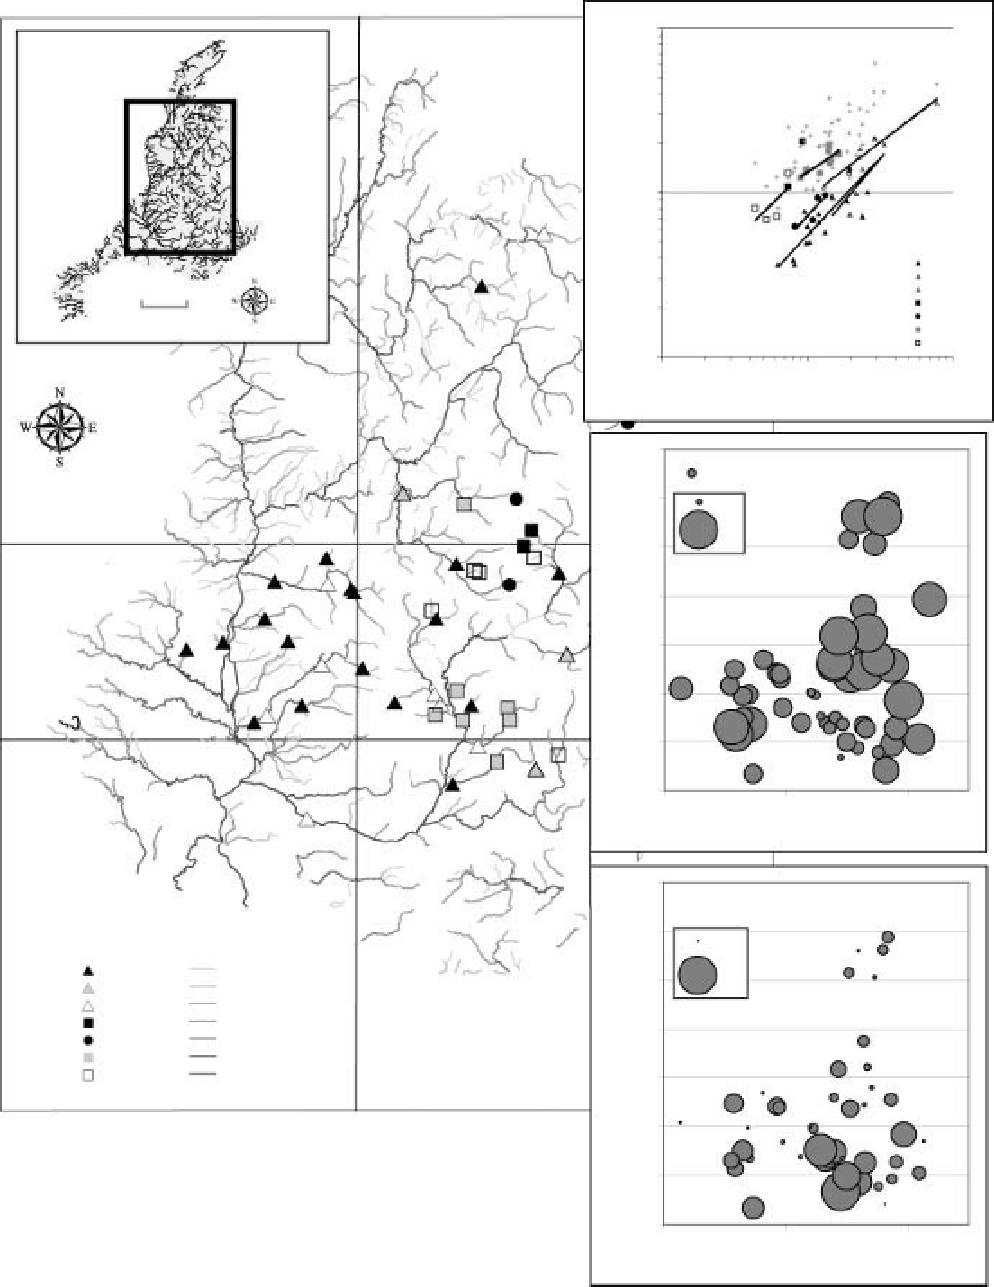
Figure 11.11
Example of inter-site comparison and associated allogenic model. a) Distribution of the seven braided river types
within the Rh one basin (Each type corresponds to a particular elevation, average channel width, slope, and riparian forest width.
Types are detailed in Piegay et al. 2009). b) Active channel width versus catchment size scatter on which are plotted the 50 observed
reaches by type. c) Geographical distribution of studied braided reaches according to the discharge frequency observed at the date of
the airborne survey (high F(Q), low discharge, low F(Q), high discharge) and d) Ratio between the total and the flowing accumulated
aquatic channel lengths calculated for discharge observed in c) (Belletti et al., 2010).
Search WWH ::

Custom Search