Geography Reference
In-Depth Information
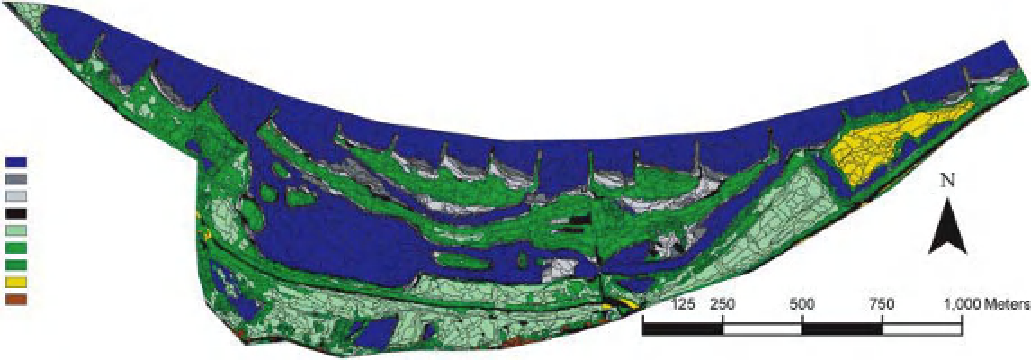
Land cover
classification
Water
Wet sand
Dry sand
Tar
Meadow
Herbaceous vegetation
Forest
Dry herbaceous vegetation
Built-up area
Figure 10.8
Classified land cover map using object-oriented segmentation and classification (river Waal, The Netherlands).
The combination of LiDAR and multispectral data
showed promising results for the parameterisation of
floodplain roughness. Straatsma and Baptist (2008) pre-
sented a method that fuses LiDAR data and airborne
multispectral data of the river Waal in The Netherlands,
the main distributary of the river Rhine. The fused data
were subsequently used in an object-oriented segmenta-
tion using eCognition. Image objects were subsequently
classified using a linear discriminant analysis, resulting in
an overall classification accuracy of 81% (Figure 10.8).
The classes 'meadow', 'unvegetated' and 'built-up' were
assigned a roughness value based on a lookup table
as no method for roughness determination exists for
these classes. For the 'herbaceous vegetation' and 'forest'
classes, vegetation height and density were determined
based on LiDAR-derived vegetation structure predictors
and regression equations. This included calibration of
the relationships in order to predict vegetation structure
based on LiDAR data using field reference data. Predictive
quality for vegetation height (0.74
new method should be implemented proved to be difficult
as there was no benchmark to compare the results to.
Secondly, the required methods are not yet available in
any commercial software, which means that quality con-
trol takes much time. In conclusion, we could say that
data fusion of multispectral and LiDAR data has proven
its ability to accurately predict vegetation structure for
floodplain roughness parameterisation. Large opportuni-
ties exist since the total surface area of The Netherlands
is mapped with LiDAR data with a 10 points/m
2
density.
Before implementation, however, the workflow should be
more automised in order to reduce production time of
the maps, and the implications of prediction errors with
respect to flood hazards should be determined.
10.5.3 Potential radardatauses for riparian
vegetationcharacterisation
The first radar operational airborne system was developed
in 1960 at the University of Michigan (USA) and in 1978,
SEASAT, the first civil radar satellite, was launched by
NASA. European Space Agency (ESA) followed in 1991
with ERS-1, ERS-2 and ENVISAT (2002), the Japanese
Space Agency (JSA) developed J-ERS-1 in 1992 and the
Canadian Space Agency (CSA) Radarsat-1 in 1995. At the
same time, the first demonstration of fully polarimetric,
multi frequency spaceborne was tested between April
and October 1994 on a space shuttle. The latest satellites
such as Alos-Palsar (Japan, 2005), TerraSAR-X (Germany,
2007) and Radarsat-2 (Canada, 2007) integrated this fully
polarimetric acquisition and improved spatial resolution
r
2
<
<
0.88; n
=
42)
r
2
was higher than for vegetation density (0.51
<
<
0.66;
n
42; Figure 10.9). Repeated field visits are a downside
of the method's feasibility. Automatic calibration may be
possible, but has not yet been worked out.
There were a number of difficulties in the implemen-
tation of the new method into the workflow of river
managers with a mandate for flood control. Firstly, the
current method, based on manual aerial image interpre-
tation, already had the ability to provide highly detailed
vegetation structure information, but no one knew exactly
how accurate it was. Convincing the managers that the
=
Search WWH ::

Custom Search