Geography Reference
In-Depth Information
(a)
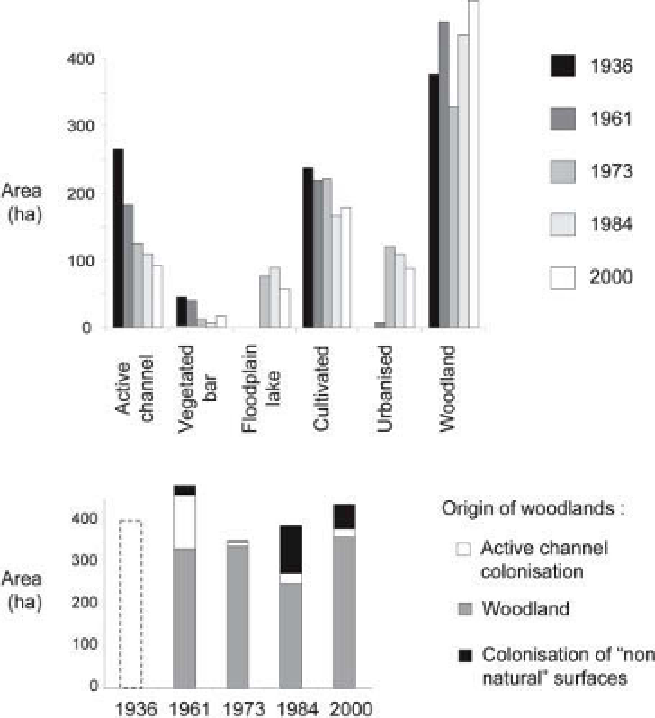
Figure 10.5
Changes of the Arve River
(France) corridor from 1936 to 2000 (for the
three most forested sites of the reach). a. Land
cover trajectory obtained by photo
interpretation, b. Changes of the origin of
woodlands.
(b)
cultivated area, woodland, pioneer units, shrub units,
floodplain lakes (i.e. former mining sites) and other 'non
natural' units (i.e. gravel mining and urban areas).
Since 1936, the channel width of the Arve River has
reduced by 200% (Figure 10.5). Two opposing riparian
historical trends are apparent: (1) a decrease in woodland
areas between 1961 and 1984 and (2) and increase in
woodlands due to both active channel narrowing before
1961 and cultivated surface abandonment since 1984
(Figure 10.5).
vegetated since 1936 (i.e. woodlands older than 68 years
old); type 2, vegetated in 1961 but not in 1936; type 3,
vegetated in 1984 but before 1961; type 4, vegetated in
2000 but not before 1984; and type 5, vegetation that
colonises surfaces that have been occupied by a human
activity since 1936 such as gravel mining, urbanisation
or cultivation (i.e. 'non-natural' vegetation). The extent
of each type was mapped. Upon these surfaces, regularly
spaced plots were implemented on a grid (cell size
=
50 m). Each dot indicates the coordinates for a potential
plot to survey (Figure 10.6). 10 plots were then randomly
selected by type. For each (20 m by 20 m), a field sur-
vey allowed the description of the vegetation structure
respecting a methodology following Dufour and Pont
(2006): overbank sediment thickness, identification and
measurement of trees with a DBH bigger then 7.5 cm, tree
regeneration, dead wood density and fauna impacts.
This stratified sampling helped optimise the field survey
for vegetation characterisation. A factorial analysis (DCA)
on the complete set of vegetation samples (for trees with
a DBH greater than 7.5 cm, i.e. 22 species) demonstrates
10.5.1.2 Riparian vegetation description and
monitoring: setting a sampling strategy
The second objective of the diagnosis phase was to
describe the composition of riparian woodlands that
colonised the Arve floodplain. To limit time and cost
spent in the field research, a stratified sampling strategy
was developed based on stand age. With the overlay of
GIS data derived from photo interpretation, five types
of vegetation units were identified (Figure 10.6): type 1,
Search WWH ::

Custom Search