Geography Reference
In-Depth Information
and imagery (Warbington et al., 2002) because available
data vary in terms of nature, spatial resolution, spectral
characteristics, temporal frequency of acquisition, age of
database, homogeneity and cost (for example see Davis et
al., 2002 and Johansen et al., 2010 for recommendations
in image choice for riparian areas) (see Table 10.4).
We may distinguish, on the one hand, reach managers
with one site or a collection of sites that work at local
scale (i.e. at a reach length between a few hundred meters
and several kilometres) and, on the other hand, managers
that deal with the entire river network (thousands of
kilometres in length). The reach managers are directly in
charge of implementing and monitoring measurements
on the ground. The river basin managers are principally
in charge of political and strategical planning at net-
work scale. This distinction, though arbitrary in many
ways because the size of a given reach can also influence
technical choices (Geerling et al., 2009), is nevertheless
useful because the two different scales usually correspond
to different objectives. The reach-scale manager needs
more detailed information about species present on the
land, the area occupied by a given vegetation type, the
health condition of a given species, stand structure, exotic
species extension and changes of the riparian community
through time. Whereas at the network scale, managers
traditionally need more general indicators of corridor
structure (continuity, fragmentation, complexity) linked
to the distribution of riparian vegetation along the net-
work and human pressures. At such scale, all of these
indicators need to be systematically evaluated across all
contexts within the watershed (Cunningham et al., 2009;
Claggett et al., 2010).
The distinction between scales is also useful as the best
approach can depend on the scale used. For example
Johansen et al. (2007a), compared field measurements
to remotely-derived riparian zone characteristics such as
percentage canopy cover, organic litter on the ground,
canopy continuity, tree clearing, bank stability and flood
damage. They showed that field measurements are more
cost effective on a fine scale (1-200 km), whereas image
analysis is superior on a larger scale (200-2000 km).
At both scales, managers should always examine the
advantages and the limitations of images with respect to
their objectives and consider other approaches, notably
field assessment, as an alternative or a complement.
Table 10.3
Evaluation of the quality of the perception of a
circular object as a function of its dimension and of the spatial
resolution of the images.
Quality of the Perception
Very
Bad
Fair
Good
Very
Bad
Good
diameter of the object (in m)
2
4
8
16
24
area of the object (in pixels)
4
16
60
216
484
% of pure pixels
0
25
53
76
86
% of mixed pixels
100
75
47
24
14
Pixel size of the image
Diameter of the object
30 m
60
120
240
480
720
20 m
40
80
160
320
480
10 m
20
40
80
160
240
5 m
10
20
40
80
120
3m
6
12
24
48
72
1m
2
4
8
16
24
30 m
20 m
10 m
0
10 m
20 m
30 m
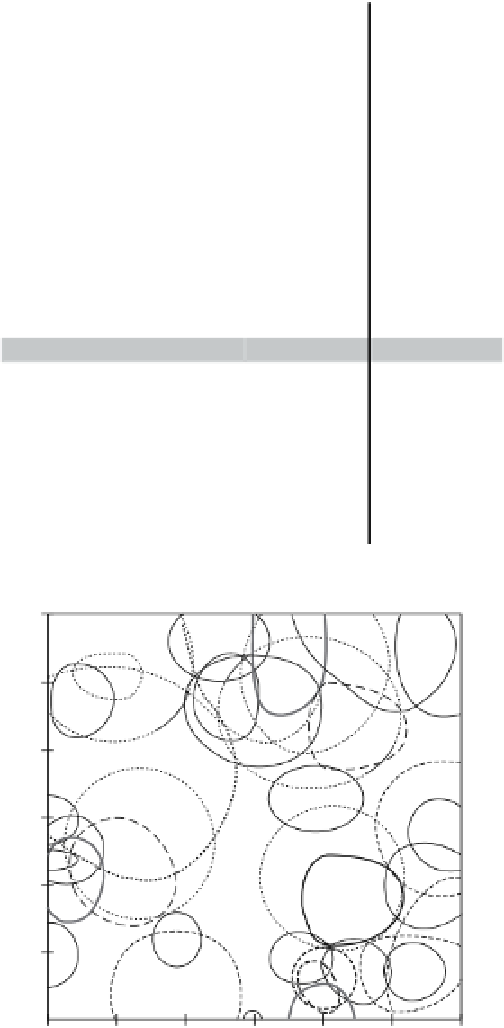
Figure 10.4
Example of the local diversity of riparian tree
canopies following field measurements within a plot equivalent
to one Spot or Landsat TM pixel.
10.4.1 Whichmanagers?Whichobjectives?
Whichapproach?
Remote imagery is used when there is a need for syn-
optic characterisation of an area, and hence an analysis
on a broad spatial scale. The scientific and/or manage-
ment objective is fundamental in choosing an approach
10.4.2 Limitationsof image-basedapproaches
With regards to riparian vegetation management, the
reach
scale
is
very
dominant
in
scientific
literature


Search WWH ::

Custom Search