Geography Reference
In-Depth Information
0.4
0.4
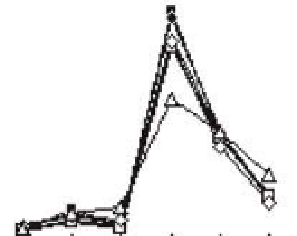
Black locust
0.3
0.3
0.2
0.2
0.1
0.1
0
0
TM1 TM2 TM3 TM4 TM5 TM7
TM1 TM2 TM3 TM4 TM5 TM7
0.4
0.4
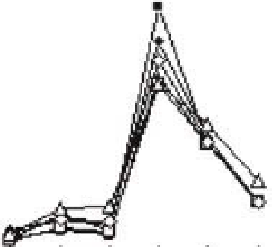
Hornbeam
0.3
0.3
0.2
0.2
0.1
0.1
0
0
TM1 TM2 TM3 TM4 TM5 TM7
TM1 TM2 TM3 TM4 TM5 TM7
0.4
0.4
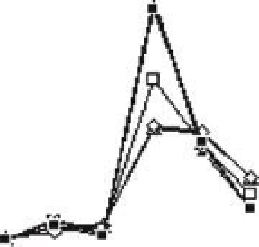
Pine
0.3
0.3
0.2
0.2
0.1
0.1
0
0
TM1 TM2 TM3 TM4 TM5 TM7
TM1 TM2 TM3 TM4 TM5 TM7
0.4
0.4
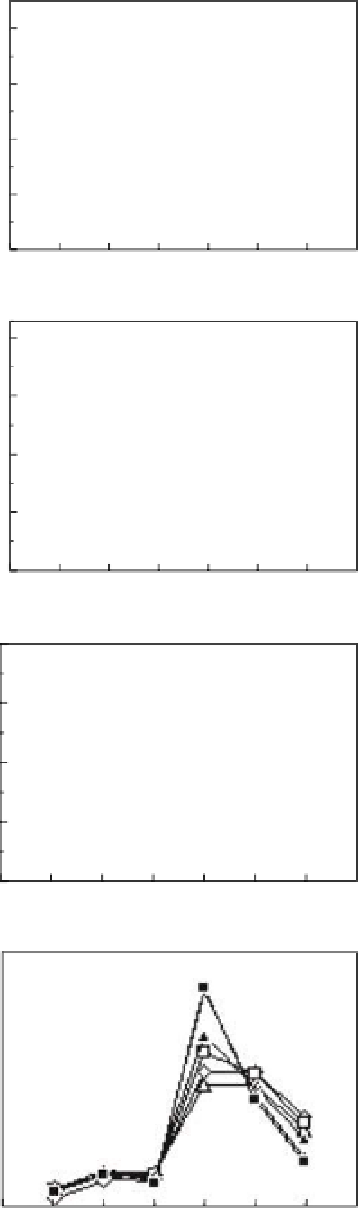
Oak
0.3
0.3
0.2
0.2
0.1
0.1
0
0
TM1 TM2 TM3 TM4 TM5 TM7
TM1 TM2 TM3 TM4 TM5 TM7
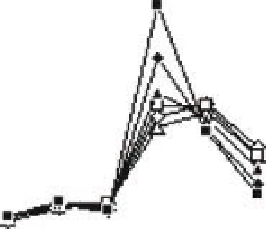
Figure 10.3
Typical mean spectral signatures of floodplain trees in the Garonne Valley (SW France) extracted from Thematic
Mapper images at 12 different dates in a year. Reflectance values were corrected from atmospheric disturbances. TM4 seems efficient
for discriminating most species, however high variations (not shown here) exist around the mean values and prevent an easy
discrimination.


Search WWH ::

Custom Search