Geography Reference
In-Depth Information
200
100
80
70
60
50
40
y
109exp(
0.59x)
=
−
R
2
0.20
=
30
0
0.1
0.2
0.3
0.4
Depth [m]
0.5
0.6
0.7
0.8
0.9
(a)
2.5
2
1.5
1
0.5
0
y
=
0.95x
+
0.03
R
2
0.19
=
−
0.5
0
0.1
0.2
0.3
0.4
Observed depth [m]
0.5
0.6
0.7
0.8
0.9
1
(b)
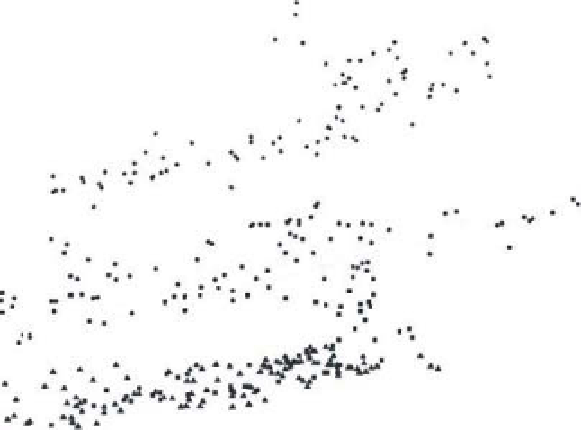
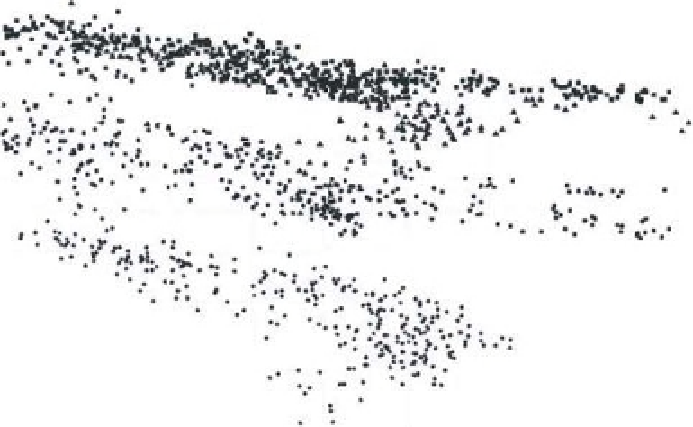
Figure 9.9
a) Calibration relationship of field-measured depth values versus image brightness in the red band with regression
equation allowing for the prediction of depth from image brightness values. Three parallel bands can be seen which correspond to
three slightly different levels of base illuminations in the imagery b) Validation relationship testing the predictions of the calibration
equation versus additional, independent, field data. From Carbonneau, P. E., Lane, S. N., and Bergeron, N. 2006. Feature based image
processing methods applied to bathymetric measurements from airborne remote sensing in fluvial environments. Earth Surface
Processes and Landforms, 31(11), 1413-1423. Reproduced from Carbonneau et al. (2006), with permission fromWiley-Blackwell.


Search WWH ::

Custom Search