Geography Reference
In-Depth Information
150
1
3
8
2
4
5
6
7
100
Error column
50
0
0
10
20
30
40
Distance upstream [km]
50
60
70
80
90
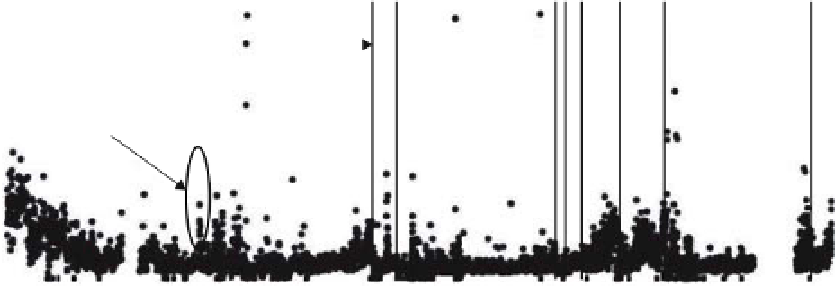
Figure 9.6
Upstream profile of airborne grain size measurements (D50) versus upstream distance along the main stem of the
Ste-Marguerite River (Quebec, Canada). From Carbonneau, P.E., N. Bergeron, and S.N. Lane (2005), Automated grain size
measurements from airborne remote sensing for long profile measurements of fluvial grain sizes, Water Resources Research, 41,
W11426, DOI:10.1029/2005WR003994. Copyright 2005 American Geophysical Union. Reproduced by permission of American
Geophysical Union.
colour photography will not do any better. In terms of
data acquisition, this clearly indicates that images must
be acquired during periods of low rainfall, turbidity and
water discharge.
Another limitation of the grain size mapping methods
developed during the Geosalar project is the need for
field calibration data. While the required fieldwork is
generally not onerous, this does increase the final cost
and limit the method to accessible rivers. However, a
few authors have sought to lift the need for calibration
data and there has been significant progress in this area.
Dugdale et al. (2010) have developed a method whereby
the grain size mapping algorithm is calibrated by direct
on-screen measurements. This approach, dubbed 'Aerial
Photosieving', thereforemimics traditional ground-based
photosieving methods. The method relies on hyperspatial
imagery. With this imagery, the user measures the b-axis
(intermediate axis) of the coarse clasts which are visible in
the image. This measurement is done directly on-screen
and requires no fieldwork provided that the scale of the
image (i.e. the pixel size) is accurately known. This use
of on-screen data thus enables the grain size mapping
process to be applied to areas which are inaccessible or
to archival imagery. However, the method was found
to result in a slight systematic overestimation of sizes
and relies on the presence of coarse clasts that can be
distinguished in the image (approximately larger than
2-4 pixels). Furthermore, significant progress has been
made by other authors working in coastal environments.
Buscombe and Masselink (2009) and Buscombe et al.
(2010) have developed amethod based on Fourier analysis
which can derive particle sizes without any calibration
from field or on-screen data. This method has been
successfully applied to coastal environments and shows
much promise for river environments.
For most river sciences applications, it is suggested
that the advantages offered by the airborne grain size
mapping methods far outweigh their limitations. Indeed,
in the Sainte-Marguerite River study case, the method
allowed over 3 million bed material size measurement
to be obtained over the entire 80 km-long studied river
section. Clearly, such a large volume of data points would
be impossible to collect with any other methods. Long
awaited for by stream ecologists, such a level of habitat
description can now start being incorporated into new
study designs that will help improve the understanding
and modelling of fish/habitat interactions.
9.3.5 Exampleof applicationofgrainsize
mapsand longprofiles tosalmon
habitatmodelling
Figure 9.7 shows an example of the unique map product
that can be obtained by combining the automated air-
borne methods of grain size measurements for both the
wet and dry portions of the channel.
Despite some loss of accuracy and precision compared
to ground based methods, such an image provides a high-
resolution, synoptic description of grain size over the
entire image. Moreover, the process can be quickly and
easily reproduced for the hundreds of images necessary
to cover the entire riverscape.
As part of the Geosalar project, Hedger et al. (2006)
showed how such grain size maps could be used to
improve the predictionof juvenileAtlantic salmondensity


Search WWH ::

Custom Search