Geography Reference
In-Depth Information
250
600
200
150
400
100
200
50
y
=
1.33x
+
18.95
R
2
=
0.85
y
=
1.23x
+
2.4
R
2
=
0.80
0
0
0
0
100
200
Semivariance
300
400
50
100
Observed grain size [mm]
150
200
250
(a)
(b)
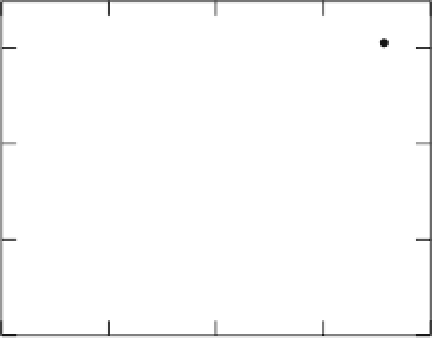
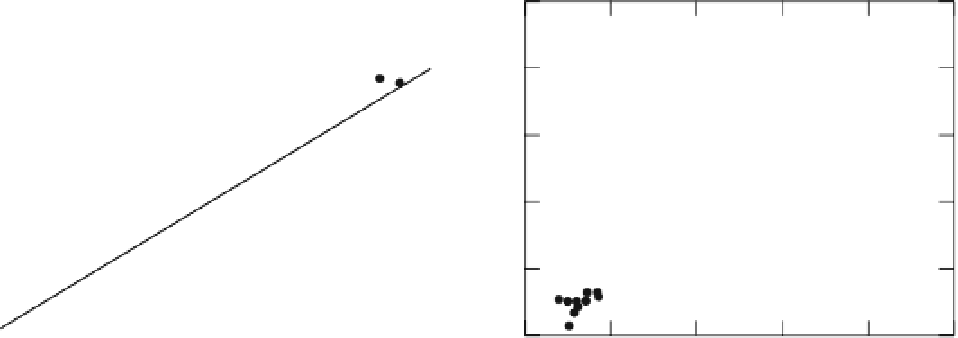
Figure 9.5
a) Calibration curve between the local semivariance of pixel brightness and the corresponding field measure of bed
material size (D50) for the wetted are of the channel. b) Validation curve showing the relationship between the observed and
predicted grain size values. The dashed line shows the expected 1:1 relationship. From Carbonneau, P.E., N. Bergeron, and S.N. Lane
(2005), Automated grain size measurements from airborne remote sensing for long profile measurements of fluvial grain sizes, Water
Resources Research, 41, W11426, DOI:10.1029/2005WR003994. Copyright 2005 American Geophysical Union. Reproduced by
permission of American Geophysical Union.
clarity and the quality of image-based grain size mapping
outputs is not yet known. This therefore leads to a crucial
point about the application of remote sensing to particle
size mapping: the measurement of particle sizes for large
areas at high spatial resolutions comes at the cost of a loss
of accuracy and precision for each individual measure-
ment. If a single particle size measurement derived from
the methods of Carbonneau et al. (2004) or Carbonneau
et al. (2005a) is compared to those derived from ground
based methods, it will inevitably be found that the quality
of individual measurements are inferior. It is therefore
important to appreciate the value of these airborne meth-
ods in view of the large spatial extent and high resolution
of the coverage they provide.
and 80 and are associated with short periods of camera
malfunctions where no images were collected.
9.3.4 Limitationsof airbornegrain
sizemapping
As mentioned previously, grain size mapping methods
based on airborne imagery generate data whose quality is
somewhat lesser than ground based methods. At the out-
set, users interested in the application of this technology
must realise that these methods do not measure the size
of each visible clast with millimetric accuracy. Instead,
they measure the median diameter of a patch of gravel
(usually 1m
2
) with precisions in the area of
10-30mm.
Another key limitation of such image based methods is
the requirement that the patch of clasts be visible in the
imagery. This precludes any size measurements below the
exposed surface of the gravel layer. Furthermore, in the
case of the wetted perimeter, the feasibility and resulting
quality of grain size mapping process is heavily dependent
on the clarity of the water. Currently, only Carbonneau
et al. (2005a) and Carbonneau et al. (2012) have pub-
lished remotely sensed grain size values in the wetted
perimeter. Therefore, it is still difficult to empirically
define the required threshold of water clarity. However,
as a rule of thumb, a simple visual appraisal is suggested:
if the river bed cannot be visually seen from the banks or
from a bridge due to high turbidity, then conventional
±
9.3.3 Riverscapescalegrainsizeprofileandfish
distribution
Automated airborne grain size mapping methods based
on imagery can be extended to entire channels provided
suitable imagery is available. Using the image analysis
method described above on the Geosalar image data set
of the Sainte-Marguerite River, Carbonneau et al. (2005a)
proceeded to show an upstream profile of median grain
sizes (Figure 9.6). This profile was constructed by taking
themedian of all available grain sizemeasurements within
each 20m reach of the entire 80 km length of the river.
The only breaks in this continuous profile are near km 18


Search WWH ::

Custom Search