Geography Reference
In-Depth Information
SMR was used in conjunction with field data in order
to perform a direct empirical verification. With a sim-
ple field procedure, local samples of median grain size
were then taken in the field. These samples were pre-
cisely positioned with a DGPS systemwhich allowed their
location in the airborne hyperspatial imagery to be iden-
tified. After experimenting with several types of image
texture metrics, Carbonneau et al. (2004) opted for the
two dimensional image semivariance. This is a similar
measure to the texture discussed above. A flat uniform
image with nearly identical brightness values will have a
low semivariance as well as a low texture. Inversely, an
image with a strong 'salt and pepper' aspect where pixels
of very different brightness are in close spatial proximity
will have a high texture.
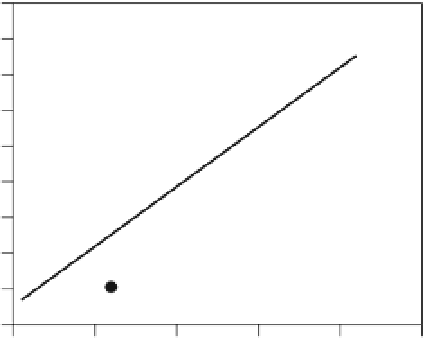
Figure 9.4 shows the result of this hypothesis test.
Figure 9.4a shows the calibration relationship which
regresses the local semivariance with the grain size
observed in the field.
Figure 9.4b shows the results of an independent vali-
dation where field based observations are tested against
the predictions of the calibration equation. These results
were quite encouraging since they established that the
information in the image had the potential to yield
quantitative measurements of particle size with minimal
fieldwork. Whilst fieldwork is indeed required for the
calibration of the relationship, this calibrated prediction
of grain size can be applied to an entire image dataset in
a fully automated manner thus allowing for the median
grain size of every exposed surface to be measured.
9.3.2.2 Grain size mapping along the wetted area
In most areas of river science and in lotic ecology in
particular, grain sizemeasurements limited todry exposed
areas are not sufficient and particle size information
for the wetted area is needed. For example, even for
images taken at summer low flow (e.g. Figure 9.3), a
significant fraction of the riverbed is underwater. The
crucial question then becomes the extent to which the
information content in this wetted but visible bed is
sufficient for particle size measurements.
In Carbonneau et al. (2005a), it was demonstrated that
in clear shallow flow situations, enough information is
contained in the images to extract particle sizes. How-
ever, it was also demonstrated that the presence of the
water degraded the precision and accuracy of the grain
size mapping results. Figure 9.5 shows the results of the
calibration process in submerged areas. The calibration
equation in Figure 9.5a shows a strong correlation. How-
ever, the validation equation in Figure 9.5b, with a slope
of 1.23, shows that larger particle sizes are over-predicted.
This loss of data quality is not entirely surprising since
the water interface inevitably degrades the image quality
for submerged areas. Furthermore, the extent of this
degradation will obviously be a function of water clarity
and the exact, quantitative, relationship between water
180
160
140
120
100
80
60
40
20
0
y
=
0.335x
+
10.12
R
2
= 0.80
300
y
=
1.03x
−
0.57
R
2
= 0.96
250
200
150
100
50
0
0
100
200
Semivariance
300
400
500
0
50
100
Observed grain size [mm]
150
200
250
300
(a)
(b)
Figure 9.4
a) Calibration curve between the local semivariance of pixel brightness and the corresponding field measure of bed
material size (D50) on a dry gravel bar. b) Validation curve showing the relationship between the observed and predicted grain size
values. The dashed line shows the expected 1:1 relationship. From Carbonneau, P.E., Bergeron N.E., Lane, S.N. (2004),
Catchment-scale mapping of surface grain size in gravel bed rivers using airborne digital imagery, Water Resources Research, 40,
W07202, DOI:10.1029/2003WR002759. Copyright 2004 American Geophysical Union. Reproduced by permission of American
Geophysical Union.


Search WWH ::

Custom Search