Geography Reference
In-Depth Information
chapter). The compressed brightness levels will reduce
image texture thereby making a clear segmentation of
sand and gravels more prone to errors.
much smaller than the clasts. In Figure 9.3, the pixel size
is well within the gravel range. Consequently, individual
clasts cannot be delineated in the airborne hyperspatial
imagery. Therefore, photosieving methods mentioned
above, which rely on such particle delineations, will only
function in the cases of particles in the cobble to boulder
range (Dugdale et al., 2010). However, textural methods
such as that used to identify sand patches do not rely on
the delineation of the individual objects that create the
texture pattern (sometimes called 'texels'). A key ques-
tion is therefore the extent to which the texture metrics
used to identify sand are in fact capable of a continuous
measurement of the spatial distribution of particle sizes.
9.3.2 Airbornegrainsizemeasurements
While themethods mentioned above are an improvement
over visual surveys, they retain one key limitation of
traditional field based sampling from the ground: they do
not allow for a continuous coverage at riverscape scales.
The obvious solution is therefore to move towards the
use of airborne imagery. As mentioned in Chapters 2
and 8, high resolution, hyperspatial imagery of fluvial
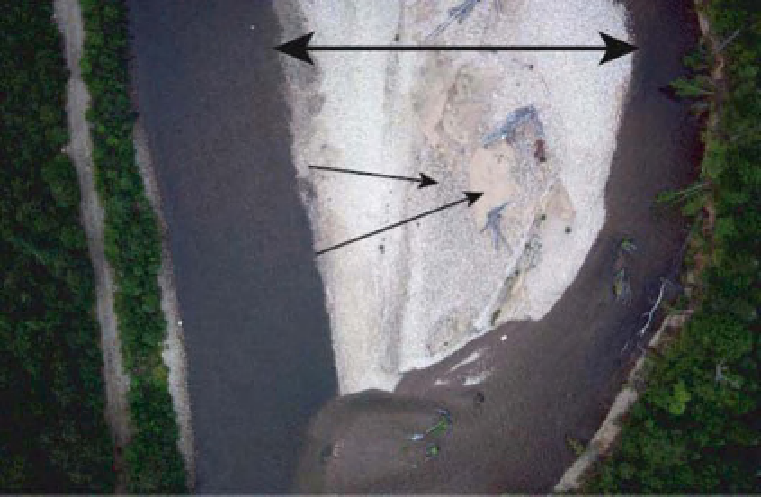
environments carries a wealth of details. Figure 9.3 shows
a hyperspatial image (spatial resolution: 3 cm) where it
is relatively easy to distinguish coarse versus fine gravels
(or sand) and deep versus shallow water.
This image, and others like it, leads once again to
hypothesise that the information content in the image
should allow for a quantitative measurement of bedmate-
rial grain size andwater depth.However, the reader should
be reminded that even hyperspatial imagery cannot rival
ground based imagery in terms of spatial resolution. In
the case of Figure 9.2a, the ground resolution of the image
was 0.3mm. The 3 cm resolution of Figure 9.3 is therefore
two orders of magnitude coarser by comparison. This
has important implications for any grain size mapping
process. In the case of Figure 9.2a, the size of each pixel
is similar to the size of an individual grain of sand and
9.3.2.1 Dry gravel bar grain size mapping
Although fish live underwater, the determination of bed
material size on exposed gravel bars is important since
at higher flows, these zones become inundated and may
make-up an important proportionof the available habitat.
The quantification of bed material size from hyperspatial
imagery is thus first explored for that simplest case: that
of a dry exposed gravel bar with a range of materials from
sands to cobbles. Figure 9.3 clearly allows identifying
sandy patches in the centre of the mid-channel bar
and coarser material can also be seen on either side.
Carbonneau et al. (2004) hypothesised that image texture
can be correlated to local grain size in the image. In
order to test this hypothesis, hyperspatial imagery of the
Deep
40 m
Gravel/Cobble
Sand
Shallow
Figure 9.3
Example of one the hyperspatial images of the Sainte-Marguerite River (Quebec, Canada) obtained for the Geosalar
project. This 3 cm ground resolution image was taken at an altitude of 150m above ground.
Search WWH ::

Custom Search