Geography Reference
In-Depth Information
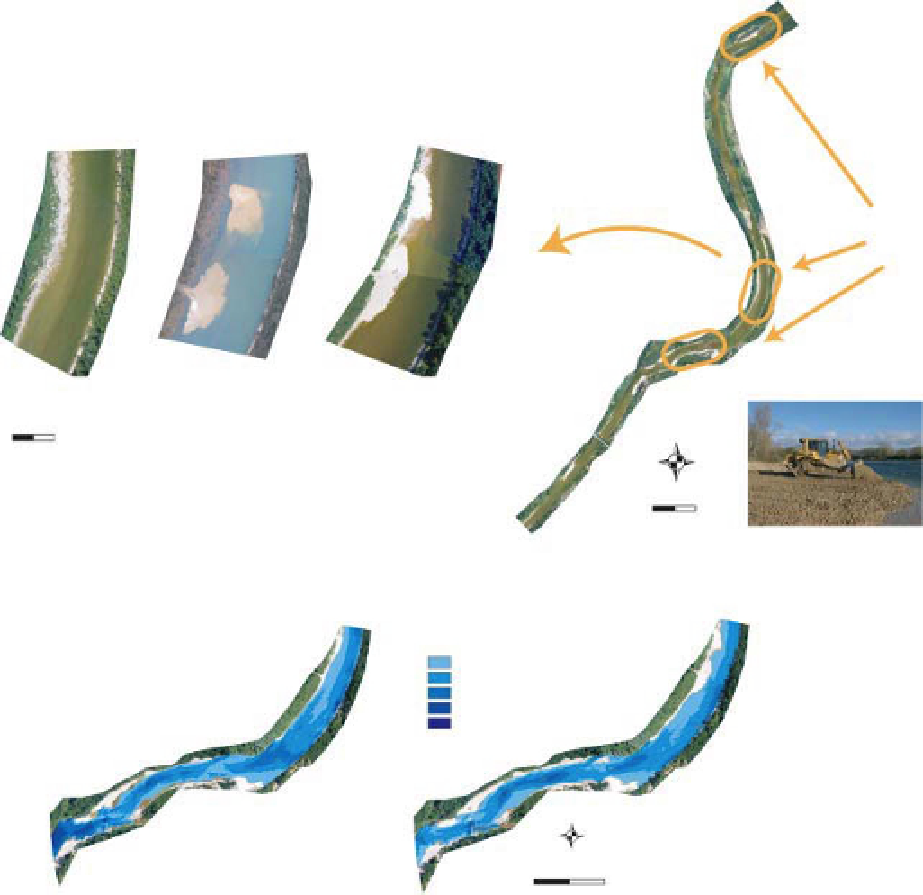
Our second example focuses on river restoration. For
river restoration, the ability to monitor a restoration
before and after it is completed is crucial in order to
evaluate the success of the restoration and to monitor
the evolution of the restored system. This procedure
has been applied in an EU LIFE program focused on
sediment reintroduction of the Ain River, France. To
evaluate the channel bathymetry of these efforts, sev-
eral surveys were done using high resolution images
acquired by the Pixy UAV. The photos (Figure 8.19a)
show one of the three sites before, immediately after and
a few months after 18,800 m
3
of sediment was intro-
duced. Bathymetric models were produced for July 2005
and June 2006 in order to map the evolution of wetted
channel topography (Figure 8.19b). Estimates of resid-
ual error of the bathymetric models were realised from
field measurements. Estimated elevation errors ranged
from 12.5 to 21 cm. These errors were produced by
Pre-restoration image *
(2005/07/19)
Image just after
sediment
reintroduction *
(2006/02/22)
Post-restoration image *
(2006/06/30)
Zoom
Sites of sediment
reintroduction
0
50 meters
N
* Aerial survey done by pixy drone
W
E
S
0
150 300 meters
(a)
Deposit areas in the main channel
2005 survey
2006 survey
Water depth (cm)
0 to
−
50
−
50 to
−
100
−
100 to
−
150
−
150 to
−
200
> 200
N
WE
S
0
100
200 meters
(b)
Figure 8.19
Monitoring restoration efforts with hyperspatial image data. Example of the sediment reintroduction in the Ain river
channel, France. a) Images acquired at different dates showing the site before introduction, after introduction and after the first flood.
b) Bathymetric maps following field and airborne surveys. c) map showing the different stages needed to assess morphological
changes from bathymetric comparisons.
Search WWH ::

Custom Search