Geography Reference
In-Depth Information
resolution SAR data to users (analogous to ESA-ESRIN's
FAIRE system for ASAR/ERS-2 data, which delivers pro-
cessed geo-registered images to users in about three hours
(Cossu et al., 2009)) have still to be developed.
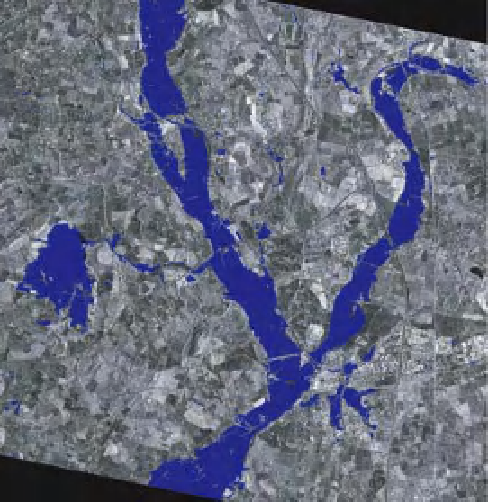
Figure 6.9 shows a possible multi-scale visualisation of
the flood extents in the rural and urban areas, with flood-
ing shown as blue in the rural area and yellow in the urban
area. Regions coloured brown in the urban area are areas
of shadow/layover that are below the waterline height
Figure 6.8
TerraSAR-X sub-image of the July 2007 flood in the
urban areas of Tewkesbury (2.6
×
2 km, dark areas
=
water)
(
©
DLR 2007).
flood peak (Figure 6.8). LiDAR data provided a DEM in
the urban area of Tewkesbury.
The flood extent estimated by TerraSAR-X in the
urban and rural areas was validated using the flood
extent estimated from aerial photos (Mason et al., 2012,
in press). In the urban area, 75% of the urban water
pixels visible to TerraSAR-X were correctly detected,
though this percentage reduced somewhat if the urban
flood extent visible in the aerial photos and detected by
TerraSAR-X was considered, because flooded pixels in the
shadow/layover areas not visible to TerraSAR-X then had
to be taken into account. Better flood detection accuracy
was achieved in rural areas, with almost 90% of water
pixels being correctly detected by TerraSAR-X.
As well as algorithm development, it is also necessary
to consider operational impediments to the production
of a near real-time flood extent. In order to ensure that
a SAR image was obtained in near real-time, it would
be necessary to minimise the time delay between an
overpass and the production of the resulting SAR flood
extent. Pre-processing operations such as calculation of
radar shadow and layover could be carried out in parallel
with tasking the satellite to acquire the image. Taking
as example TerraSAR-X imaging of the UK, download
of the raw SAR data to the ground station, followed by
near real-time processing to a multi-look image, geo-
registering this automatically, and delineating the flood
extent, could in theory be carried out in four to five
hours after overpass. The time to extract the flood extent
would be small compared to the time to carry out the
SAR processing. However, as far as is known, operational
systems for near real-time supply of geo-located high
(a)
(b)
Figure 6.9
Possible multi-scale visualisation of flood extents in
(a) rural (blue
=
predicted flood), and (b) urban areas
(yellow
shadow/layover areas that
may be flooded (after Mason et al., 2012, in press)).
=
predictedflood, brown
=


Search WWH ::

Custom Search