Geography Reference
In-Depth Information
gradual increase in soil moisture, i.e. from a dry to an
inundated state, SAR backscatter gradually increases until
water ponds on the surface which, if covered by little or no
vegetation, generally causes a sharp drop in the intensity
of the return signal as a result of the signal being reflected
away from the SAR antenna due to the specular reflection
from a smooth water surface.
For mapping flood area and extent, optical imagery has
been successfully used in numerous cases (see Marcus and
Fonstad, 2008 for a detailed review). However, systematic
application of visible or thermal satellite imagery to flood
mapping is often hampered by persistent cloud cover
during floods, particularly in small to medium-sized
catchments where floods often recede before weather
conditions improve. For thermal and visible image acqui-
sition the only solution is to use recording systems on
aircrafts flying below cloud cover. Although this requires
extensive planning and is often regarded as a rather costly
option, an effective system in place could consistently
and very rapidly deliver high quality aerial photos or
other types of imagery of a flood. For instance, an aircraft
equipped with an infrared and visible camera as well as a
LiDAR and hyperspectral imaging (CASI) system is oper-
ated by the Environment Agency of England and Wales
(http://www.geomatics-group.co.uk) and has a call-out
time of only two hours, which is hardly possible to match
with any satellite system.
Moreover, the inability to map flooding beneath veg-
etation canopies limits the applicability of these sensors.
SAR, particularly in L-band, has been shown to be a
promising tool for detection of flooding beneath vege-
tation canopy (Hess et al., 1990) as the double-bounce
reflections between smooth water surfaces and vegeta-
tion trunks or branches create a bright appearance on
the image.
In terms of microwave (radar) remote sensing SAR
imagery seems to be at the moment the only reliable
source of information for monitoring floods from
space on rivers generally
<
1 km in width; for larger
rivers, direct water level measurements with centimetric
accuracy may be obtained from radar altimetry missions
such as the Jason and Topex/Poseidon missions or
the future NASA/CNES SWOT mission (for a detailed
review see Alsdorf et al., 2007). Over the last few decades,
spaceborne SAR systems (Figure 6.2) have increasingly
been used for flood mapping. While past and current
medium-resolution SAR satellite and space shuttle radar
missions have a proven track-record for large-scale flood
mapping in X- (SIR-C/X-SAR, SRTM), C- (ERS-1/2
AMI, ENVISAT ASAR, RADARSAT-1/2, SIR-C/XSAR),
3.0
1.5
1.0
0.75
0.6
0.5
0.43
0.37
0.33
0.3
2010
TanDEM-X
COSMO-SkyMed 1-4
SAR systems in orbit
2008
Finished SAR missions
RADARSAT-2
2006
ALOS PALSAR
TerraSAR-X
2004
Envisat ASAR
RADARSAT-1
2002
SRTM
ERS-2
2000
.
1990
JERS-1
SIR-C
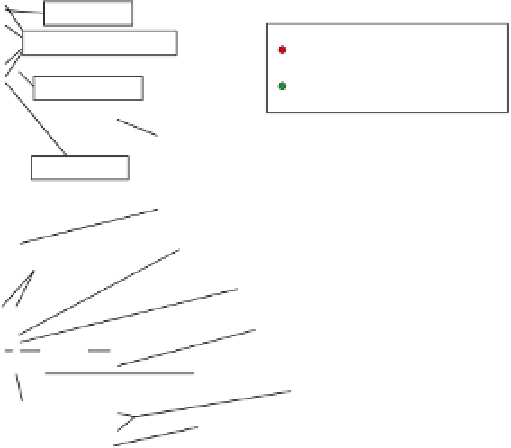
Figure 6.2
Launch of civil spaceborne SAR
missions since 1978. Wavelengths,
corresponding frequencies and commonly used
waveband letters (in green) are also shown
(Modified from Martinis, 2010 after Lillesand
et al., 2004). For planned missions, see
Table 6.5.
ALMAZ-1
SIR-A/B
.
ERS-1
SEASAT-1
1980
KXC
S
L
P
0
10
20
30
40 50
Wavelength [cm]
60
70
80
90
100


Search WWH ::

Custom Search