Environmental Engineering Reference
In-Depth Information
Table 3 Descriptive statistics of main variables
Min
Max
Mean
Std. deviation
Obs
Total patents
0
52433
3100
7447
616
pv patents
0
544
14
54
616
Wind patents
0
186
7
17
616
rdd renewables, M
€
0
1807
51
119
498
rdd pv, M
€
0
325
20
36
482
rdd wind, M
€
0
152
7
12
469
Total deployment, MW
0
57050
1507
4232
609
pv deployment, MW
0
9303
109.3
658
609
Wind deployment, MW
0
9645
253.5
784
609
Observations per country, per year
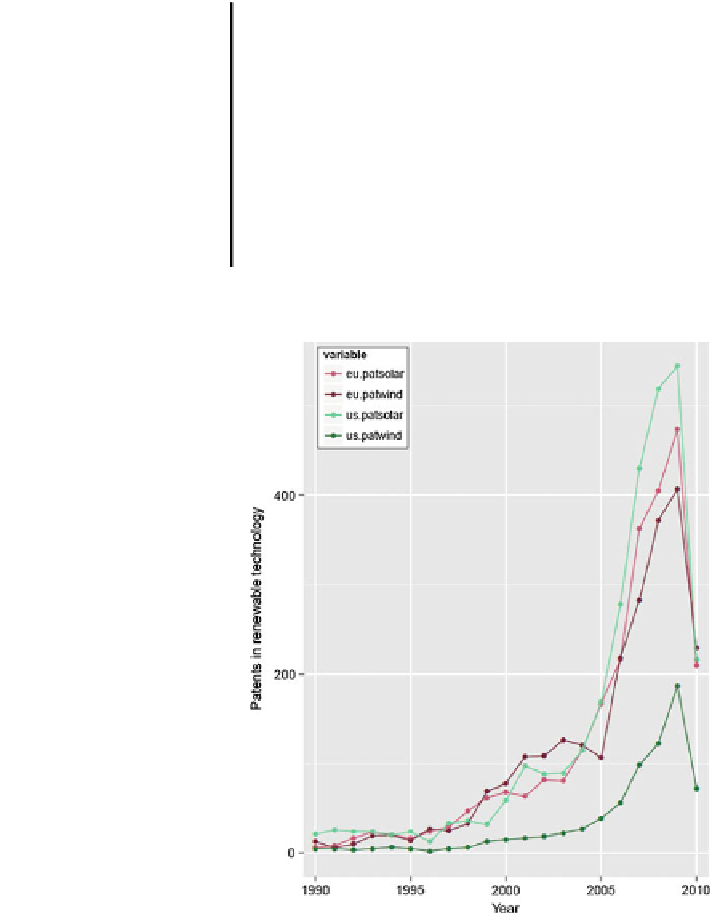
Fig. 4 Solar and wind
patents US and EU
cantly
behind US wind deployment (Fig.
5
). On the other side of the Atlantic, EU solar
deployment is outpacing EU wind deployment from 2009 on
Despite the stronger patenting in solar, US solar deployment lags signi
—
cumulated capaci-
ties stay still larger.


Search WWH ::

Custom Search