Environmental Engineering Reference
In-Depth Information
the presence of one or two thresholds in the data. During the second step, we
conclude that the TVAR model with two thresholds is preferable. Table
4
also
shows that the threshold value is equal to 0.0072 at delay
d
= 1, and 0.0302 at delay
d
=2.
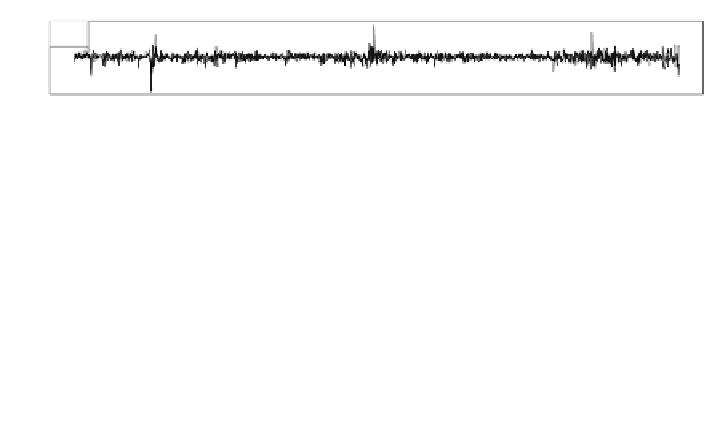
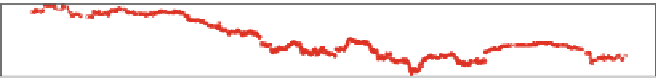
To put these values into perspective, Fig.
3
plots the threshold variable and the
threshold values for the TVAR model estimated with CO
2
and macroeconomic
variables. The threshold variable used is pictured in the top panel. The bottom
panels represent, respectively, the ordered threshold variable detected with a
trimming parameter of 10 % (see [
23
]) and the threshold value (as a function of the
SSR) results of the grid search procedure.
The TVAR estimates are reproduced in the bottom panels of Table
4
.By
minimizing the AIC as the usual criterion, the number of lags in the TVAR was set
at two (for more details, see [
4
]). In what follows, we comment on the lower and
higher regimes estimates. According to the
“
macroeconomic approach
”
de
ned in
Sect.
3.2
, the results con
rm that signi
cant in
uences exist between CO
2
futures
prices and macroeconomic activity [
2
,
3
,
5
,
9
11
,
24
]. What is new is that these
relationships are studied in a nonlinear framework, as advised by [
12
].
The results are qualitatively similar between the lower- and higher-regimes.
Namely, in the lower-regime, we uncover the strong in
-
uence on the carbon price
coming from the industrial production index, in addition to the autoregressive
component. Regarding the sign, we observe logically that during the lower-regime,
the (downward sloping) aggregated industrial production index affects negatively
the carbon price. On the contrary, there is no
from the carbon
price to the EU industrial production, for which only lagged values of the index are
found to be statistically signi
“
bounce back effect
”
cant (at the 1 % level).
Threshold variable used
th 1
th 2
0
500
1000
1500
2000
Time
Ordered threshold variable
trim= 0.1
th 1
th 2
0
500
1000
1500
2000
Results of the grid search
Threshold Delay
th 1
th 2
1
-0.03
-0.02
-0.01
0.00
0.01
0.02
0.03
Threshold Value
Fig. 3 TVAR estimation results for EUAs and EU industrial production


Search WWH ::

Custom Search