Database Reference
In-Depth Information
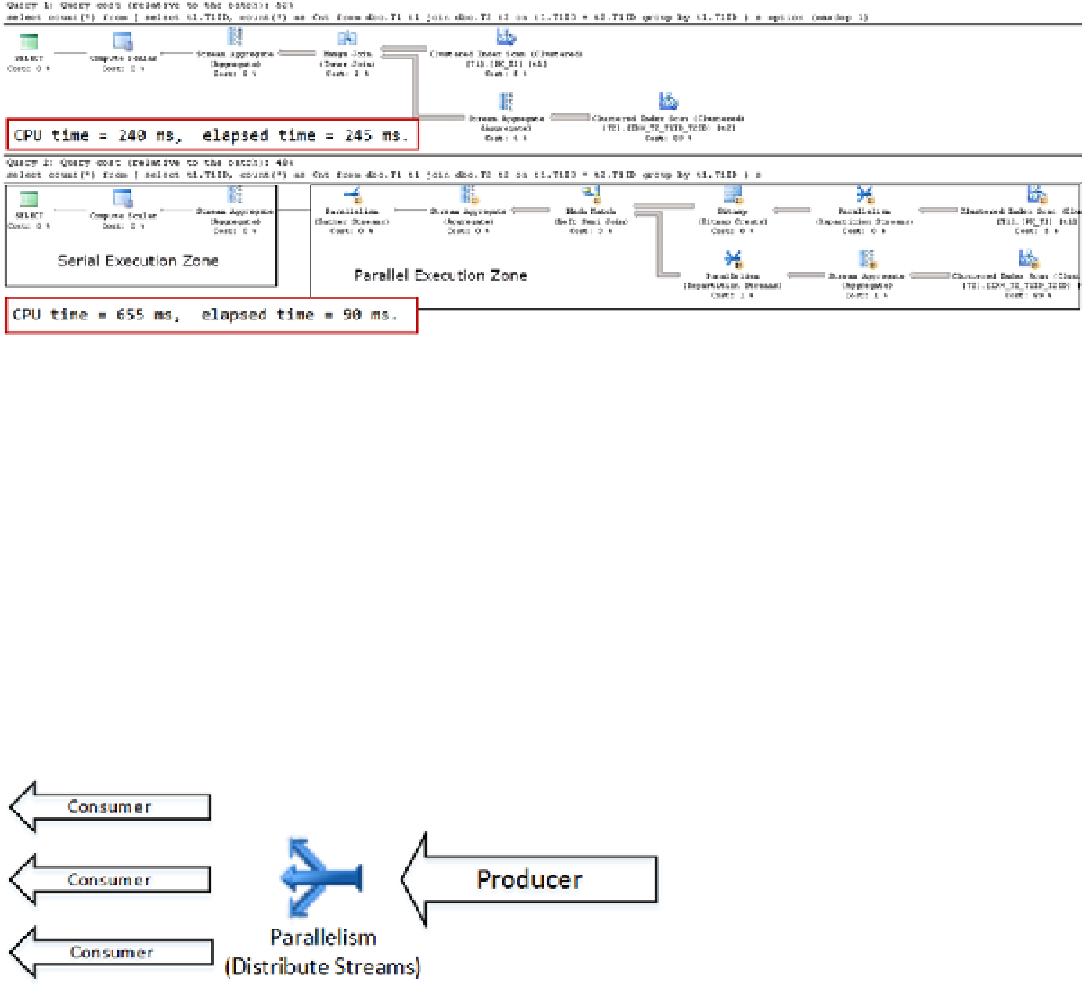
Figure 25-14.
Parallel Execution: Query Plans
As you can see, the response (elapsed) time of the first query is much slower than that of the second query:
245 milliseconds versus 90 milliseconds. However, the total CPU time of the first query is much lower compared to
second query: 240 milliseconds versus 655 milliseconds. We are using CPU resources for parallelism management.
A parallel execution plan does not necessarily mean that all operators are executing in parallel. An execution
plan can have both parallel and serial execution zones. The parallel plan shown in Figure
25-14
runs a subquery in a
parallel zone and an outer
count(*)
calculation serially.
The
Parallelism
operator, sometimes called
Exchange
, manages parallelism during query execution, and it can
run in three different modes. It accepts the input data from one or more
producer
threads and distributes it across one
or more
consumer
threads. Let's take an in-depth look at those modes.
In
Distribute Streams
mode, the
Parallelism
operator accepts data from one producer thread and distributes it
across multiple consumer threads. This mode is usually the entry point to the parallel execution zone in the plan.
Figure
25-15
illustrates this concept.
Figure 25-15.
Parallelism: Distribute Streams
In
Gather Streams
mode, the
Parallelism
operator merges the data from multiple producer threads and passes
it to a single consumer thread. This mode is usually the exit point from the parallel execution zone in the plan.
Figure
25-16
illustrates this idea.