Database Reference
In-Depth Information
Each stage has its own entry and termination conditions. For example, Stage 0 requires a query to have at least
three-table joins; otherwise, it will not be executed. Alternatively, if the cost of the plan exceeded some threshold
during optimization, the stage is terminated and Query Optimizer moves on to the next, more comprehensive, stage.
Optimization can be completed at any stage, as soon as a “
good enough”
plan is found.
You can examine the details of the optimization process by using undocumented trace flag 8675. The usual
disclaimer about undocumented trace flags applies here: be careful, and do not use them in production. You also
need to use trace flag 3604 to redirect output to the console.
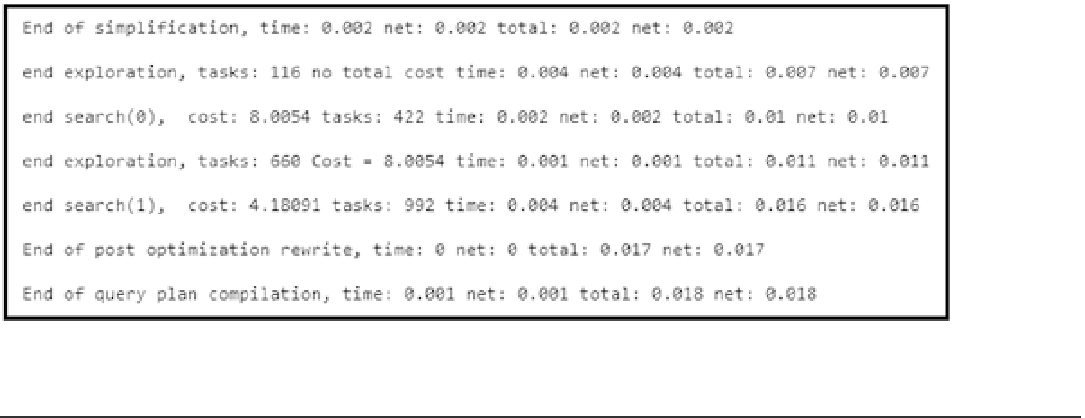
Figure
25-5
illustrates the optimization statistics for one of the queries. As you can see, SQL Server performed
Stage 0 and Stage 1 optimizations, generating the execution plan after Stage 1.
Figure 25-5.
Optimization statistics returned by trace flag 8675
■
the documented data management view
sys.dm_exec_query_optimizer_info
, allows you to retrieve Query
Optimizer related statistics. While this dmV provides a great overview in server scope, it does not allow you to filter
information for the specific session, which makes it very hard to use in busy environments. you can get more information
Note
Finally, when Query Optimizer is satisfied with the optimization results, it generates the execution plan.
As you can guess, SQL Server analyzes and explores a large number of alternative execution strategies during
the query optimization stage. Those alternatives, which are part of the query tree, are stored in the part of Query
Optimizer called
Memo
. SQL Server performs cost estimation for every group in Memo, which allows it to locate the
least expensive alternative when generating an execution plan.
The cost calculation is based on a complex mathematical model, and it considers various factors, such as
cardinality, row size, expected memory usage and number of sequential and random I/O operations, parallelism
overhead, and others. The costing numbers and plan cost are meaningless by themselves; they should be used for
comparison only.
There are quite a few assumptions in the costing model that help to make it more consistent.
Random I/O is anticipated to be evenly distributed across the database files. For example,
if an execution plan requires performing ten
RID Lookup
operations in a heap table, the
costing model would expect that ten random physical I/O operations would be required.
In reality, the data can reside on the same data pages, which can lead to a situation where
Query Optimizer overcosts some operators in the plan.