Database Reference
In-Depth Information
■
Note
We will talk about Wait statistics analysis in Chapter 27, “system Troubleshooting.”
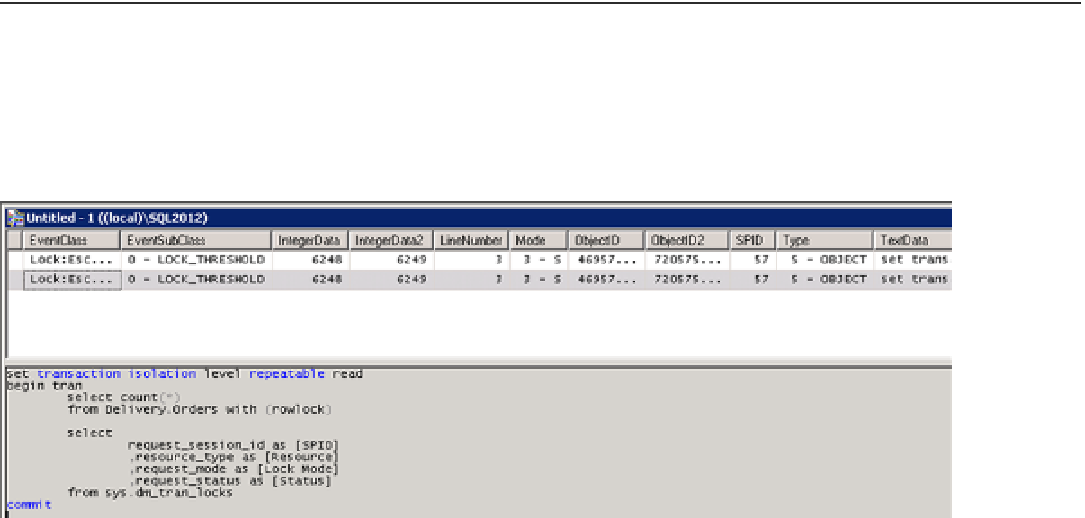
You can capture the
Lock Escalation
SQL Trace event. Figure
20-5
illustrates the output from this event in the SQL
Profiler application.
Figure 20-5.
Lock Escalation event in SQL Server Profiler
The following attributes are useful during troubleshooting:
•
EventSubClass
indicates what triggered lock escalation—number of locks or memory
threshold.
•
IntegerData
and
IntegerData2
show the number of locks that existed at the time of the
escalation and how many locks were converted during the escalation process.
•
Mode
tells what kind of lock was escalated.
•
ObjectID
is the object_id of the table for which lock escalation was triggered.
•
ObjectID2
is the
HoBT
ID for which lock escalation was triggered.
•
Type
represents lock escalation granularity.
•
TextData
,
LineNumber
, and
Offset
provide the information of the batch and statement that
trigger lock escalation.
There is also
Table Lock Escalations/sec
performance counter in the
SQL Server Access Methods
section that can
be useful for baselining the system and, of course,
lock_escalation
Extended Event.
■
Note
We will discuss extended events in Chapter 28, “extended events.”
From the blocked session standpoint, if you run the code shown in Listing 18-2 (Chapter 18), you will see the
results shown in Figure
20-6
.