Database Reference
In-Depth Information
mode="X" associatedObjectId="72057594039500800">
<owner-list>
<owner id="process3e6a890c8" mode="X"/>
</owner-list>
<waiter-list>
<waiter id="process3e4b29868" mode="S" requestType="wait"/>
</waiter-list>
</keylock>
<keylock hobtid="72057594039500800" dbid="14"
objectname="SqlServerInternals.Delivery.Orders"
indexname="PK_Orders" id="lock3e98ba500"
mode="X" associatedObjectId="72057594039500800">
<owner-list>
<owner id="process3e4b29868" mode="X"/>
</owner-list>
<waiter-list>
<waiter id="process3e6a890c8" mode="S" requestType="wait"/>
</waiter-list>
</keylock>
</resource-list>
The name of the XML element identifies the type of resource.
Keylock
,
pagelock
, and
objectlock
stand for
the row-level, page and object locks, respectively. You can also see to what objects and indexes those locks belong.
Finally,
owner-list
and
waiter-list
nodes provide you information about the processes that own and wait for the
locks as well as the type of locks acquired and requested.
As you have probably already guessed, the next steps are very similar to the blocked process troubleshooting;
that is, you need to pinpoint the queries involved in the deadlock and find out why deadlock occurs. There is one
important factor to consider: in most cases, deadlock involves more than one statement per session running in the
same transaction. The deadlock graph provides you the information about the last statement only—the one that
triggered the deadlock. You can see the
signs
of the other statements in the
resource-list
node. It shows you that
processes held exclusive (X) locks on the rows, but it does not tell you about the statements that acquired them. It is
very useful to look at all of the statements involved while analyzing the root cause of the problem.
In our case, when you look at the listing shown in Figure
19-16
, you would see the two statements. The
update
statement updates the single row—it acquires and holds exclusive (X) lock there. You can see that both processes own
those exclusive (X) locks in the
resource-list
node of the deadlock graph.
In the next step, you need to understand why select queries are trying to obtain shared (S) locks on the rows with
exclusive (X) locks held. You can look at the execution plans for
select
statements from the
process
nodes by either
running the queries or by using
sys.dm_exec_query_stats
DMV, as shown in Figure 18-5 in the previous chapter.
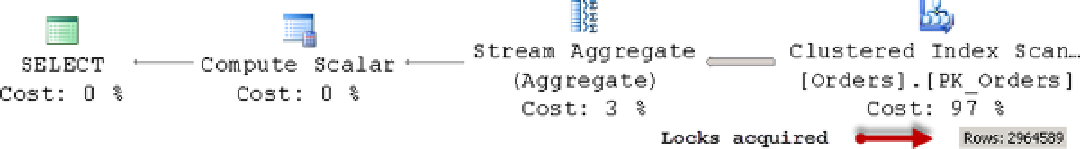
As a result, we will get the execution plans shown in Figure
19-18
. The figure also shows the number of the locks
acquired during the query execution.
Figure 19-18.
Execution plan for the query